
Lesson: Statistics
Exercise 13.1 (26)
Question: 1
In the formula , for finding the mean of
i i
i
fd
x a
f
grouped data are deviation from of
i
d 's
a
a. lower limits of the classes
b. upper limits of the classes
c. mid – points of the classes
d. frequencies of the class marks
Solution:
(c)
, where is data and is assumed mean.
i i
d x a
i
x
a
Thus, are the deviation from of mid – points of
i
d 's
a
the classes.
Hence, the option (C) is correct.

Question: 2
While computing mean of grouped data, we assume
that the frequencies are:
a. evenly distributed over all the classes
b. centred at the class marks of the classes
c. centred at the upper limits of the classes
d. centred at the lower of the classes
Solution:
(b)
In computation of mean of grouped data, the
frequencies are centred at the class marks of the
classes.
Hence, the option (B) is correct.
Question: 3
If are the mid – points of the class intervals of
i
x 's
grouped data, are the corresponding frequencies
i
f 's
and is the mean, then is equal to:
x
i i
f x x
a. 0
b. (B)
1
c. 1
d. 2

Solution:
(a)
The mean of the data is given by , where
i i
f x
x
n
i
n f
i i i i
f x x f x x
nx nx
0
i
x nx
Hence, the option (A) is correct.
Question: 4
In the formula , for finding the mean
i i
i
fu
x a h
f
of grouped frequency distribution is equal to:
i
u
a.
i
x a
h
b.
i
h x a
c.
i
x a
h
d.
i
a x
h
Solution:
(c)

Given: ,
i i
i
fu
x a h
f
Above formula is used in step deviation method.
i
i
x a
u
h
Where is data and is assumed mean and is
i
x
a
h
class size.
Hence, the option (C) is correct.
Question: 5
The abscissa of the point of intersection of the less
than type and of the more than type cumulative
frequency curves of a grouped data gives its
a. mean
b. median
c. mode
d. All of these
Solution:
(b)
Since, the intersection point of less than ogive and
more than ogive gives the median on the abscissa.
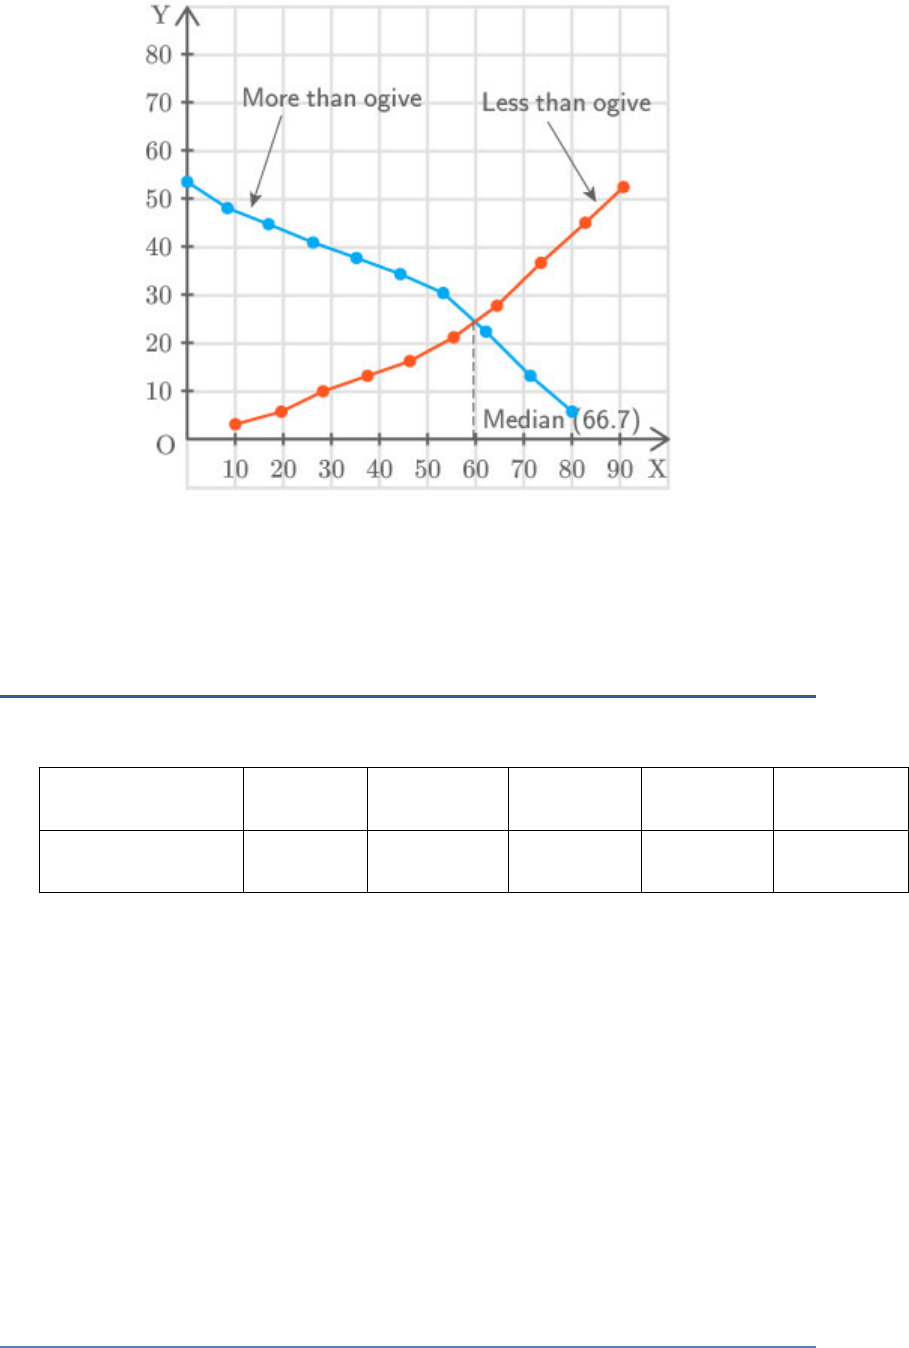
Hence, the option (B) is correct.
Question: 6
For the following distribution:
Class
0 – 5
5 – 10
10 – 15
15 – 20
20 – 25
Frequency
10
15
12
20
9
the sum of lower limits of the median class and modal
class is:
a. 15
b. 25
c. 30
d. 35
Solution:
(b)

Class
Frequency
Cumulative frequency
0 – 5
10
10
5 – 10
15
10 15 25
10 – 15
12
25 12 37
15 – 20
20
37 20 57
20 – 25
9
57 9 66
Now, , which lies in the interval 10 – 15.
n 66
33
2 2
Lower limit of the median class is 10.
The highest frequency is 20.
Lower limit of modal class is 15.
Hence, the required sum is
10 15 25
Hence, the option (B) is correct.
Question: 7
Consider the following frequency distribution:
Class
0 – 5
6 – 11
12 – 17
18 – 23
24 – 29
Frequency
13
10
15
8
11
The upper limit of the median class is:
a. 17
b. 17.5
c. 18
d. 18.5

Solution:
(b)
The given classes are not continuous, so subtract 0.5
from the lower limit and add 0.5 to the upper limit of
each class to make it continuous.
Class
Frequency
Cumulative frequency
0.5 – 5.5
13
13
5.5 – 11.5
10
13 10 23
11.5 – 17.5
15
23 15 38
17.5 – 23.5
8
38 8 46
23.5 – 29.5
11
46 11 57
Here, , which lies in the interval 11.5 –
n 57
28.5
2 2
17.5.
So, the upper limit is 17.5.
Hence, the option (B) is correct.
Question: 8
For the following distribution:
Marks
Number of students

Below 10
Below 20
Below 30
Below 40
Below 50
Below 60
3
12
27
57
75
80
the modal class is:
a. 10 – 20
b. 20 – 30
c. 30 – 40
d. 50 – 60
Solution:
(C)
The frequency distribution table along with the
cumulative frequency is given by,
Marks
Number of students
Cumulative frequency
Below 10
3
3
10 – 20
12 3 9
12
20 – 30
27 12 15
27
30 – 40
57 27 30
57
40 – 50
75 57 18
75

50 – 60
80 75 5
80
The highest frequency is 30, which lies in the interval
30 – 40.
Hence, the option (C) is correct.
Question: 9
Consider the data:
Class
65 – 85
85 – 105
105 –
125
125 –
145
145 –
165
165 –
185
185 –
205
Frequency
4
5
13
20
14
7
4
The difference of the upper limit of the median class
and the lower limit of the modal class is:
a. 0
b. 19
c. 20
d. 38
Solution:
(c)
Class
Frequency
Cumulative frequency
65 – 85
4
4

85 – 105
5
4 5 9
105 – 125
13
9 13 22
125 – 145
20
22 20 42
145 – 165
14
42 14 56
165 – 185
7
56 7 63
185 – 205
4
63 4 67
Here, , which lies in the interval 125 –
n 67
33.5
2 2
145.
So, upper limit of the median class is 145.
The highest frequency is 20, which lies in 125 – 145.
Hence, the lower limit of modal class is 125.
Required Upper limit Lower limit of
difference of median modal class
145 125
20
Hence, the option (C) is correct.
Question: 10
The times, in seconds, taken by 150 athletes to run a
110 m hurdle race are tabulated below:
Class
13.8 – 14
14 – 14.2
14.2 – 14.4
14.4 – 14.6
14.6 – 14.8
14.8
– 15

Frequency
2
4
5
71
48
20
The number of athletes who completed the race in less
than 14.6 seconds is:
a. 11
b. 71
c. 82
d. 130
Solution:
(c)
The number of athletes who completed the race in less
than
14.6seconds 2 4 5 71 82
Hence, the option (C) is correct.
Question: 11
Consider the following distribution:
Marks obtained
Number of students
More than or equal to 0
63
More than or equal to 10
58
More than or equal to 20
55
More than or equal to 30
51
More than or equal to 40
48

More than or equal to 50
42
the frequency of the class 30 – 40 is:
a. 3
b. 4
c. 48
d. 51
Solution:
(d)
The frequency distribution table is given by,
Marks obtained
Number of students
i
f
0 – 10
63
10 – 20
58
20 – 30
55
30 – 40
51
40 – 50
48
50 – 60
42
So, the frequency of the class 30 – 40 is 51.
Hence, the option (D) is correct.
Question: 12
If an event cannot occur, then its probability is:
a. 1

b.
3
4
c.
1
2
d. 0
Solution:
(d)
The event which cannot occur, is said to be impossible
event and probability of impossible event is zero.
Hence, the option (D) is correct
Question: 13
Which of the following cannot be the probability of an
event?
a.
1
3
b. 0.1
c. 3 %
d.
17
16
Solution:
(d)
Probability of an event always lies between 0 and 1.
The maximum probability of an event
1

The minimum probability of an event
0
But is more than , so it cannot be the probability
17
16
1
of an event.
Hence, the option (D) is correct.
Question: 14
An event is very unlikely to happen. Its probability is
closest to:
a. 0.0001
b. 0.001
c. 0.01
d. 0.1
Solution:
(a)
If an event is very unlikely to happen, its probability
should be quite small.
Hence, the option (A) is correct.
Question: 15
If the probability of an event is , then the probability
p
of its complementary event will be:

a.
p 1
b.
p
c.
1 p
d.
1
1
p
Solution:
(c)
Probability of an event probability of its complementary event
1
So, probability of its complementary event
Probability of an e t1 ven
1 p
Hence, the option (C) is correct.
Question: 16
The probability expressed as a percentage of a
particular occurrence can never be:
a. less than 100
b. less than 0
c. greater than 1
d. anything but a whole number
Solution:
(b)

The probability of an event always lies between and
0
1
.
So, the probability expressed in terms of percentage
always lies between and .
0
100
So, it cannot be less than .
0
Hence, the option (B) is correct.
Question: 17
If P(A) denotes the probability of an event A, then
a. P(A)
0
b. P(A)
1
c.
0 p A 1
d.
1 p A 1
Solution:
(c)
Probability of an event always lies between 0 and 1.
Hence, the option (C) is correct.
Question: 18
If a card is selected from a deck of 52 cards, then the
probability of its being red face card is:

a.
3
26
b.
3
13
c.
2
13
d.
1
2
Solution:
(a)
In a deck of cards there are 52 cards in total.
So, total number of outcomes
52
There are 12 face cards i.e., 6 red (3 hearts and 3
diamonds) and 6 black (3 spades and 3 clubs) cards.
Favourable outcomes
6
favourableNumber of outcomes
Number of to
P
t
ro
al
babi
outc
li
s
ty
ome
6
52
3
26
Hence, the option (A) is correct.
Question: 19

The probability that a non–leap year selected at
random will contains 53 Sunday is:
a.
1
7
b.
2
7
c.
3
7
d.
5
7
Solution:
(a)
A non–leap year has 365 days and so it has 52 weeks
and 1 day.
This 1 day can be Sunday or Monday or Tuesday or
Wednesday or Thursday or Friday or Saturday.
Thus, total outcomes
7
Favourable outcome
1
Probability
Number of outcomes
Number of tot
favou
al out
rable
comes
1
7
Hence, the option (A) is correct.
Question: 20

When a die is thrown, the probability of getting an
odd number less than 3 is:
a.
1
6
b.
1
3
c.
1
2
d. 0
Solution:
(a)
When a die is thrown, then total number of outcomes
6
Odd number less than 3 is the number 1 only.
Number of favourable outcomes
1
Probability
Number of outcomes
Number of tot
favou
al out
rable
comes
1
6
Hence, the option (A) is correct.
Question: 21

A card is drawn from a deck of 52 cards. The event E is
that card is not an ace of hearts. The number of
outcomes favourable to E is:
a. 4
b. 13
c. 48
d. 51
Solution:
(d)
Total number of cards in a deck are 52.
Total number of outcomes
52
There are 13 cards of heart out of which 1 is ace of
heart.
So, the number of favourable outcomes to E
52 1 51
Hence, the option (D) is correct.
Question: 22
The probability of getting a bad egg in a lot of 400 is
0.035. The number of bad eggs in the lot is:
a. 7
b. 14
c. 21

d. 28
Solution:
(b)
According to the question,
Total number of eggs
400
Probability of getting a bad egg
0.035
number of bad eggs
Probability
total number of eggs
number of bad eggs
0.035
total number of eggs
number of bad eggs
0.035
400
Number of bad eggs 400 0.035
14
Hence, the option (B) is correct.
Question: 23
A girl calculates that the probability of her winning
the first prize in a lottery is 0.08. If 6000 tickets are
sold, how many tickets has she bought?
a. 40
b. 240
c. 480
d. 750

Solution:
(c)
According to the question,
Total number of tickets sold (total outcomes)
6000
Let the girl bought number of tickets.
x
Favourable outcomes
x
Probability of her winning the first prize is given by,
favourableNumber of outcomes
Number of to
P
t
ro
al
babi
outc
li
s
ty
ome
x
0.08
6000
x 0.08 6000
x 480
Thus, she bought 480 tickets.
Hence, the option (C) is correct.
Question: 24
One ticket is drawn at random from a bag containing
tickets numbered 1 to 40. The probability that the
selected ticket has a number which is a multiple of 5
is:
a.
1
5

b.
3
5
c.
4
5
d.
1
3
Solution:
(a)
Number of total outcomes
40
Multiples of 5 between the numbers to
1
40
5,
10,
14,
20,
25,
30,
35,
40
Total number of favourable outcomes
8
favourableNumber of outcomes
Number of to
P
t
ro
al
babi
outc
li
s
ty
ome
8
40
1
5
Hence, the option (A) is correct.
Question: 25
Someone is asked to take a number from . The
1to100
probability that it is a prime is:

a.
1
5
b.
6
25
c.
1
4
d.
13
50
Solution:
(c)
Total numbers of outcomes
100
The prime numbers between are
1to100
2,
3,
5,
7,
11,
13,
17,
23,
29,
31,
37,
41,
43,
47,
53,
59,
61,
67,
71,
73,
79,
83,
89
and
97.
Total number of favourable outcomes
25
favourableNumber of outcomes
Number of to
P
t
ro
al
babi
outc
li
s
ty
ome
25
100
1
4
Hence, the option (C) is correct.
Question: 26

A school has five houses A, B, C, D and E. A class has
23 students, 4 from house A, 8 from house B, 5 from
house C, 2 from house D and rest from house E. A
single student is selected at random to be the class
monitor. The probability that the selected student is
not from A, B and C is:
a.
4
3
b.
6
23
c.
8
23
d.
17
23
Solution:
(b)
Total number of students in a class (total
23
outcomes)
Number of students in house A
4
Number of students in house B
8
Number of students in house C
5
Total number of students in houses A, B and C
altogether
4 8 5 17

Number of remaining students
23 17 6
(favourable outcomes)
Probability that the selected student is not from A, B
and C is given by,
favourableNumber of outcomes
Number of to
P
t
ro
al
babi
outc
li
s
ty
ome
6
23
Hence, the option (b) is correct.
Exercise 13.2 (14)
Question: 1
The median of an ungrouped data and the median
calculated when the same data is grouped are always
the same. Do you think that this is a correct
statement? Give reason.
Solution:
The statement is not correct. The median of an
ungrouped data and the median calculated when the
same data is grouped are not always the same,
because the median for ungrouped data is calculated

by organizing the data in increasing or decreasing
order.
Whereas, for calculating the median of a grouped
data, the formula used is based on the presumption
that the observations are evenly distributed in the
classes.
Question: 2
In calculating the mean of grouped data, grouped in
classes of equal width, we may use the formula
where is the assumed mean. must
i i
i
fd
x a
f
a
a
be one of the mid-points of the classes. Is the last
statement correct? Justify your answer.
Solution:
The last statement is not necessarily correct.
Assumed mean can be considered any favourable
number which makes the calculation easy and it
might be the mid – point of the classes.
Question: 3

Is it true to say that the mean, mode and median of
grouped data will always be different? Justify your
answer.
Solution:
The statement in the question is not true always.
The median, mean and mode can be same, if the
number of observations are odd and have equal class
size.
Question: 4
Will the median class and modal class of grouped data
always be different? Justify your answer.
Solution:
The given statement is not true.
The median and modal class may be equal, if modal
class is median class which is not always possible as
the number of frequencies may be maximum in any
class.
Question: 5

In a family having three children, there may be no girl,
one girl, two girls or three girls. So, the probability of
each is . Is this correct? Justify your answer.
1
4
Solution:
The statement is incorrect.
According to the question,
Let us consider boy as B and girl as G.
So, in a family of three children possible outcomes
may be (B, B, B,) (G, B, B), (G, G, B), (G, G, G).
Now total number of outcomes is 4.
So, the probability of each is not , because the
1
4
outcomes are not equally likely.
Question: 6
A game consists of spinning an arrow which comes to
rest pointing at one of the regions . Are the
1,2and3
outcomes 1, 2 and 3 equally likely to occur? Give
reasons.
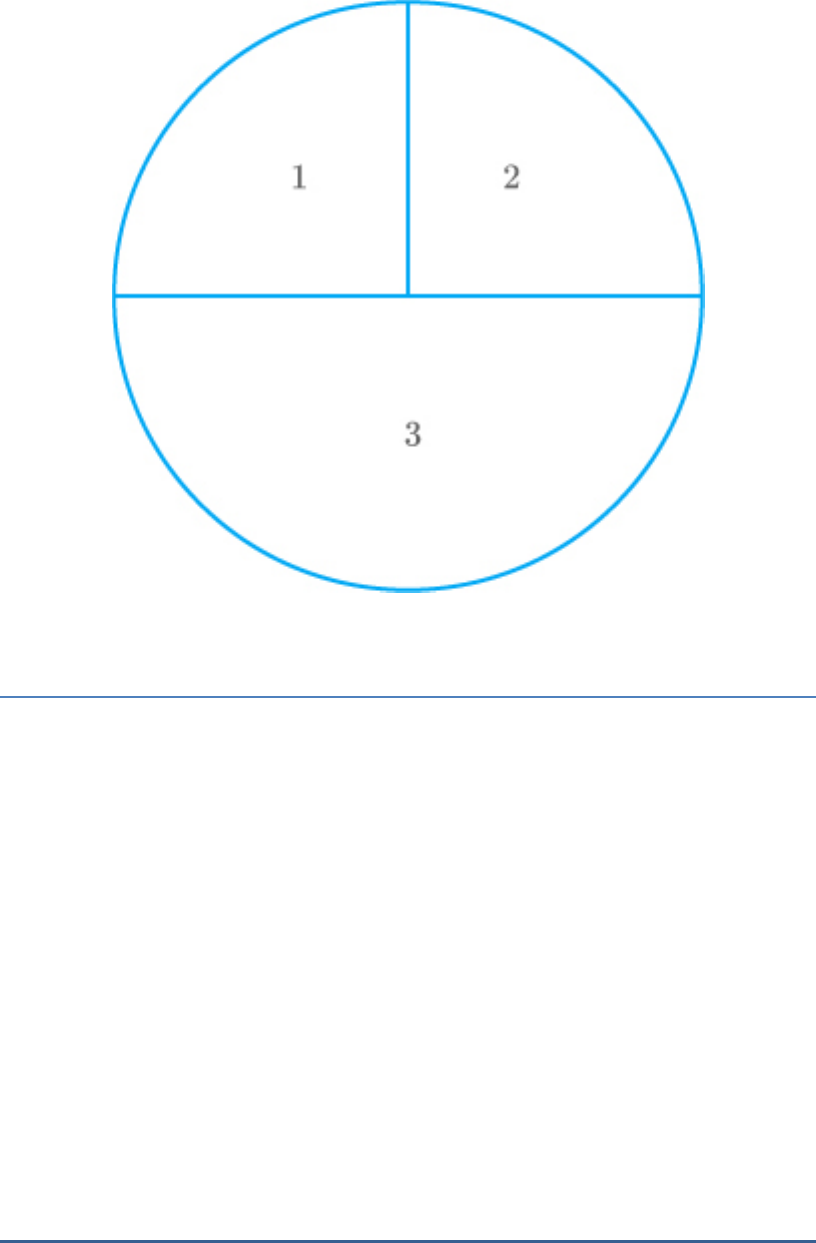
Solution:
According to the given figure,
The area of part 3 of the circle is double the area of
either 1 or 2 and area of the parts 1 and 2 are equal.
Number of favourable outcomes of part 3 is double of
either 1 or 2.
Thus, the outcomes of 1, 2 and 3 are not equally likely
to occur.
Question: 7
Apoorv throws two dice once and computes the
product of the numbers appearing on the dice. Peehu
throws one die and squares the number that appears

on it. Who has the better chance of getting the
number 36? Why?
Solution:
If 2 dice are thrown together, then the total number of
outcomes is 36 and if one die is thrown and square of
the number is taken, then the total number of
outcomes is 6.
Now, for Apoorv, the total number of outcomes is 36.
But, the favourable event is only one i.e.
6,6
So, the probability that Apoorv gets the number 36 is
given by,
favourableNumber of outcomes
Number of to
P
t
ro
al
babi
outc
li
s
ty
ome
1
36
Now, for Peehu, the total number of outcomes is 6.
But, the favourable event is only one i.e.
2
6 36
So, the probability that Peehu gets the number 36 is
given by,
favourableNumber of outcomes
Number of to
P
t
ro
al
babi
outc
li
s
ty
ome
1
6

Now,
1 1
6 36
Hence, Peehu has the better chance to get the number
36.
Question: 8
When we toss a coin, there are two possible outcomes
– Head or Tail. Therefore, the probability of each
outcome is . Justify your answer.
1
2
Solution:
There are two favourable outcomes if a coin is tossed
and this probability is equal in all manner.
Thus, the probability of getting head and tail is equal
to each.
1
2
Hence, the given statement is true.
Question: 9
A student says that if you throw a die, it will show up
1 or not 1. Therefore, the probability of getting 1 and
the probability of getting ‘not 1’ each is equal to . Is
1
2
this correct? Give reasons.

Solution:
When a dice is thrown, the possible outcomes are
given by 1, 2, 3, 4, 5 or 6.
The total number of outcomes are 6.
favourableNumber of outcomes
Number of to
P
t
ro
al
babi
outc
li
s
ty
ome
Now, the probability of getting (1)
1
6
The numbers other than and and
1
2,
3,
4,
5
6.
So, total number of favourable outcomes
5
The probability of getting (not 1)
5
6
Thus, the probability of getting 1 and the probability
of getting ‘not 1’ each is not equal to .
1
2
Hence, the given statement is not correct.
Question: 10
I toss three coins together. The possible outcomes are
no heads, 1 head, 2 heads and 3 heads. So, I say that
probability of no heads is . What is wrong with this
1
4
conclusion?

Solution:
On tossing a coin the possible outcomes are two i.e.
head or tail.
Let head be H and tail be T.
According to the question,
Three coins are tossed.
So, total number of events
3
2 8
(TTH), (THH), (HTH), (HHT), (HTT), (THT), (HHH),
and (TTT)
So, the probability of getting no head is given by,
favourableNumber of outcomes
Number of to
P
t
ro
al
babi
outc
li
s
ty
ome
1
8
Hence, the given statement is incorrect.
Question: 11
If you toss a coin 6 times and it comes down heads on
each occasion. Can you say that the probability of
getting a head is 1? Give reasons.
Solution:
According to the question,

A coin is tossed 6 times and it comes down heads on
each occasion.
So, total number of outcomes
6
But, on tossing a coin the possible outcomes are two
i.e. head or tail.
So, in total six events, number of favourable outcomes
for getting head
3
Thus, the probability of getting head is given by,
favourableNumber of outcomes
Number of to
P
t
ro
al
babi
outc
li
s
ty
ome
3
6
1
2
Hence, the given statement is false.
Question: 12
Sushma tosses a coin 3 times and gets tail each time.
Do you think that the outcome of next toss will be a
tail? Give reasons.
Solution:
On tossing a coin the possible outcomes are two i.e.
head or tail.

According to the question,
The coin is tossed 3 times and gets tail each time.
But it is not necessary that the outcome of the next
toss will be tail. It may either be tail or head.
Hence, the given statement is false.
Question: 13
If I toss a coin 3 times and get head each time, should
I expect a tail to have a higher chance in the 4
th
toss?
Give reason in support of your answer.
Solution:
On tossing a coin the possible outcomes are two i.e.
head or tail and both head and tail have equal
chances.
So, on tossing the coin for the 4
th
time, the outcome
can either be tail or head.
Hence, the given statement is false.
Question: 14
A bag contains slips numbered from 1 to 100. If Fatima
chooses a slip at random from the bag, it will either be
an odd number or an even number. Since this

situation has only two possible outcomes, so, the
probability of each is . Justify.
1
2
Solution:
According to the question,
The bag contains slips numbered from 1 to 100.
It contains 50 even and 50 odd numbers.
Now, the total number of outcomes
100
Number of favourable outcomes for getting an even
number
50
So, the probability of getting an even number is given
by,
favourableNumber of outcomes
Number of to
P
t
ro
al
babi
outc
li
s
ty
ome
50
100
1
2
Number of favourable outcomes for getting an odd
number
50
So, the probability of getting an odd number is given
by,
favourableNumber of outcomes
Number of to
P
t
ro
al
babi
outc
li
s
ty
ome

50
100
1
2
Hence the probability of getting odd and even each is
.
1
2
Hence, the given statement is true.
Exercise 13.3 (42)
Question: 1
Find the mean of the distribution:
Class
1 – 3
3 – 5
5 – 7
7 – 10
Frequency
9
22
27
17
Solution:
First, find the class mark for each interval. For
i
x
this, the following relation should be used.
i
Upper limit Lower limit
x
2
Now, calculate and .
i
x
i i
x f
Class
Frequency ( )
i
f
i
x
i i
x f

1 – 3
9
2
18
3 – 5
22
4
88
5 – 7
27
6
162
7 – 10
17
8.5
144.5
Total
75
412.5
From the table,
and
i
f 75
i i
f x 412.5
Now, find the value of mean.
Mean
i i
i
f x
x
f
412.5
75
5.5
Hence, the mean of distribution is .
5.5
Question: 2
Calculate the mean of the scores of 20 students in a
mathematics test:

Marks
10 – 20
20 – 30
30 – 40
40 – 50
50 – 60
Number of
students
2
4
7
6
1
Solution:
First, find the class mark for each interval. For
i
x
this, the following relation should be used.
i
Upper limit Lower limit
x
2
Now, calculate and .
i
x
i i
x f
Marks
Number of students
i
f
i
x
i i
f x
10 – 20
2
15
30
20 – 30
4
25
100
30 – 40
7
35
245
40 – 50
6
45
270
50 – 60
1
55
55
Total
20
700
From the table,
and
i
f 20
i i
f x 700
Now, find the value of mean.
So, Mean
i i
i
f x
x
f

700
20
35
Hence, mean number of scores is 35.
Question: 3
Calculate the mean of the following data:
Class
4 – 7
8 – 11
12 – 15
16 – 19
Frequency
5
4
9
10
Solution:
The class intervals are not continuous, as there is a
gap of between two class intervals.
1
So, must be added to the upper – class limit and
0.5
must be subtracted from the lower – class limit of
0.5
each interval.
Then, find the class mark for each interval. For
i
x
this, the following relation should be used.
i
Upper limit Lower limit
x
2
Now, calculate and .
i
x
i i
x f
Class
Frequency
i
f
i
x
i i
f x
3.5 – 7.5
5
5.5
27.5

7.5 – 11.5
4
9.5
38
11.5 – 15.5
9
13.5
121.5
15.5 – 19.5
10
17.5
175
Total
28
362
From the table,
and
i
f 28
i i
f x 362
Now, find the value of mean.
So, Mean
i i
i
f x
x
f
362
28
12.93
Hence, mean of data is 12.93.
Question: 4
The following table gives the number of pages written
by Sarika for completing her own book for 30 days:
Number of pages
written per day
16 – 18
19 – 21
22 – 24
25 – 27
28 – 30
Number of days
1
3
4
9
13
Find the mean number of pages written per day.

Solution:
The class intervals are not continuous, as there is a
gap of between two class intervals.
1
So, must be added to the upper – class limit and
0.5
must be subtracted from the lower – class limit of
0.5
each interval.
Then find the class mark for each interval. For
i
x
this, the following relation should be used.
i
Upper limit Lower limit
x
2
Now, calculate and .
i
x
i i
x f
Class
Frequency
i
f
i
x
i i
f x
15.5 – 18.5
1
17
17
18.5 – 21.5
3
20
60
21.5 – 24.5
4
23
92
24.5 – 27.5
9
26
234
27.5 – 30.5
13
29
377
Total
30
780
From the table,
and
i
f 30
i i
f x 780
Now, find the value of mean.

Mean
i i
i
f x
x
f
780
30
26
Hence, mean number of pages per day are 26.
Question: 5
The daily income of a sample of 50 employees are
tabulated as follows:
Income (in Rs)
1 – 200
201 – 400
401 – 600
601 – 800
Number of
employees
14
15
14
7
Find the mean daily income of employees.
Solution:
The class intervals are not continuous, as there is a
gap of between two class intervals.
1
So, must be added to the upper – class limit and
0.5
must be subtracted from the lower – class limit of
0.5
each interval.
Then, find the class mark for each interval. For
i
x
this, the following relation should be used.
i
Upper limit Lower limit
x
2
Class size
h 200
Take assumed mean and calculate and
a 300.5
i
d ,
i
u
as follows.
i i
fu
Number of
mangoes
Number of
boxes
i
f
i
x
i i
d x 300.5
i
i
d
u ,
h
h 200
i i
fu
0.5 – 200.5
14
100.5
200
1
14
200.5 – 400.5
15
300.5
0
0
0
400.5 – 600.5
14
500.5
200
1
14
600.5 – 800.5
7
700.5
400
2
14
Total
50
14
From the table,
and
i
f 50
i i
fu 14
Now, find the value of mean.
i i
i
fu
x a h
f
14
300.5 200
50
300.5 14 4
300.5 56

356.5
Hence, the mean number of mangoes kept in a
packing box is .
356.5
Question: 6
An aircraft has 120 passenger seats. The number of
seats occupied during 100 flights is given in the
following table:
Number of
seats
100 – 104
104 – 108
108 – 112
112 – 116
116 – 120
Frequency
15
20
32
18
15
Determine the mean number of seats occupied over
the flights.
Solution:
First, find the class mark for each interval. For
i
x
this, the following relation should be used.
i
Upper limit Lower limit
x
2
Class size
h 4
Take assumed mean and calculate and
a 110
i
d ,
i
u
as follows.
i i
fu
Number of
mangoes
Number of
boxes
i
f
i
x
i i
d x 110
i
i
d
u ,
h
h 4
i i
fu
100 – 104
15
102
8
2
30
104 – 108
20
106
4
1
20
108 – 112
32
110
0
0
0
112 – 116
18
114
4
1
18
116 – 120
15
118
8
2
30
Total
100
2
From the table,
and
i
f 100
i i
fu 2
Now, find the value of mean.
i i
i
fu
x a h
f
2
110 4
100
8
110
100
110 0.08
109.92
Hence, the mean number of seats occupied is as
109
seats cannot be in decimal.

Question: 7
The weights (in kg) of 50 wrestlers are recorded in the
following table:
Weight (in kg)
100 – 110
110 – 120
120 – 130
130 – 140
140 – 150
Number of
wrestlers
4
14
21
8
3
Find the mean weight of the wrestlers.
Solution:
First, find the class mark for each interval. For
i
x
this, the following relation should be used.
i
Upper limit Lower limit
x
2
Class size
h 10
Take assumed mean and calculate
a 125
as follows.
i i i i
d ,u and fu
Number of
mangoes
Number of
boxes
i
f
i
x
i i
d x 125
i
i
d
u ,
h
h 10
i i
fu
100 – 110
4
105
20
2
8
110 – 120
14
115
10
1
14
120 – 130
21
125
0
0
0
130 – 140
8
135
10
1
8
140 – 150
3
145
20
2
6

Total
50
8
From the table,
and
i
f 50
i i
fu 8
Now, find the value of mean.
i i
i
fu
x a h
f
8
125 10
50
8
125
5
125 1.6
123.4
Hence, the mean weight of wrestlers is kg.
123.4
Question: 8
The mileage (km per litre) of 50 cars of the same
model was tested by a manufacturer and details are
tabulated as given below:
Mileage (km/l)
10 – 12
12 – 14
14 – 16
16 – 18
Number of cars
7
12
18
13

Find the mean mileage. The manufacturer claimed
that the mileage of the model was 16 km/litre. Do you
agree with this claim?
Solution:
First, find the class mark for each interval. For
i
x
this, the following relation should be used.
i
Upper limit Lower limit
x
2
Take assumed mean and calculate and as
a 13
i
d
i i
fd
follows.
Number of
days
Number of
students
i
f
i
x
i i
d x 13
i i
fd
10 – 12
7
11
2
14
12 – 14
12
13
0
0
14 – 16
18
15
2
36
16 – 18
13
17
4
52
Total
50
i
f
74
i i
fd
From the table,
Now, find the value of mean.
i i
i
fd
x a
f

74
13
50
13 1.48
14.48
Hence, mean mileage of car is 14.48 km/litre.
The manufacturer's claim is wrong that the mileage is
.
16km/litre
Question: 9
The following is the distribution of weights (in kg) of
40 persons:
Weight
40 –
45
45 –
50
50 –
55
55 –
60
60 –
65
65 – 70
70 – 75
75 – 80
Number of
persons
4
4
13
5
6
5
2
1
Construct a cumulative frequency distribution (of the
less than type) table for the data above.
Solution:
Class intervals with their respective cumulative
frequency is given by,
Weight
Number of
persons
i
f
Weight (in
kg)
Cumulative
frequency
cf

40 – 45
4
Less than 45
4
45 – 50
4
Less than 50
4 4 8
50 – 55
13
Less than 55
8 13 21
55 – 60
5
Less than 60
21 5 26
60 – 65
6
Less than 65
26 6 32
65 – 70
5
Less than 70
32 5 37
70 – 75
2
Less than 75
37 2 39
75 – 80
1
Less than 80
39 1 40
Question: 10
The following table shows the cumulative frequency
distribution of marks of 800 students in an
examination:
Marks
Number of students
Below 10
Below 20
Below 30
Below 40
Below 50
Below 60
Below 70
Below 80
10
50
130
270
440
570
670
740

Below 90
Below 100
780
800
Construct a frequency distribution table for the data
above.
Solution:
Class intervals with their respective frequency is given
by,
Marks
Number of
students
i
x
Frequency
i
f
Below 10
10
0 – 10
10 0 10
Below 20
50
10 – 20
50 10 40
Below 30
130
20 – 30
130 50 80
Below 40
270
30 – 40
270 130 140
Below 50
440
40 – 50
440 270 140
Below 60
570
50 – 60
570 440 130
Below 70
670
60 – 70
670 570 100
Below 80
740
70 – 80
740 670 70
Below 90
780
80 – 90
780 740 40
Below 100
800
90 – 100
800 780 20
Question: 11
Form the frequency distribution table from the
following data:

Marks out of 90
Number of candidates
More than or equal to 80
More than or equal to 70
More than or equal to 60
More than or equal to 50
More than or equal to 40
More than or equal to 30
More than or equal to 20
More than or equal to 10
More than or equal to 0
4
6
11
17
23
27
30
32
34
Solution:
Class intervals with their respective frequency is given
by,
Marks out of 90
Number of
candidates
i
x
Frequency
i
f
More than or equal to 0
34
0 – 10
34 32 2
More than or equal to 10
32
10 – 20
32 30 2
More than or equal to 20
30
20 – 30
30 27 3
More than or equal to 30
27
30 – 40
27 23 4
More than or equal to 40
23
40 – 50
23 17 6
More than or equal to 50
17
50 – 60
17 11 6
More than or equal to 60
11
60 – 70
11 6 5

More than or equal to 70
6
70 – 80
6 4 2
More than or equal to 80
4
80 – 90
4 0 4
Question: 12
Find the unknown entries in the following
a,
b,
c,
d,
e,
f
distribution of heights of students in a class:
Height (in cm)
Frequency
Cumulative
frequency
150 – 155
12
a
155 – 160
b
25
160 – 165
10
c
165 – 170
d
43
170 – 175
e
48
175 – 180
2
f
Total
50
Solution:
Height (in
cm)
Frequency
Cumulative
frequency
cf
given
calculated
cf
150 – 155
12
a
12
155 – 160
b
25
12 b

160 – 165
10
c
22 b
165 – 170
d
43
22 b d
170 – 175
e
48
22 b d e
175 – 180
2
f
24 b d e
Total
50
Now, compare the calculated and given .
cf
cf
a 12 ......(1)
12 b 25
b 25 12
b 13 ......(2)
12 b 10 c
12 13 10 c
c 35 ......(3)
22 b d 43
22 13 d 43
d 43 35
d 8 ......(4)
22 b d e 48
22 13 8 e 48
e 48 43
e 5 ......(5)
22 2 b d e f

24 13 8 5 f
f 50 ......(6)
Hence, from equations and ,
1 ,
2 ,
3 ,
4 ,
5
6
and .
a 12,
b 13,
c 35,
d 8,
e 5
f 50
Question: 13
The following are the ages of 300 patients getting
medical treatment in a hospital on a particular day:
Age (in
years)
10 – 20
20 – 30
30 – 40
40 – 50
50 – 60
60 – 70
Number of
patients
60
42
55
70
53
20
Form:
(i) Less than type cumulative frequency distribution.
(ii) More than type cumulative frequency
distribution.
Solution:
Less than type frequency distribution, with their
respective cumulative frequency is given by,
Age (in years)
given
Number of
patients
i
f
Age (in years)
Cumulative
frequency
cf
0
Less than 10
0

10 – 20
60
Less than 20
0 60 60
20 – 30
42
Less than 30
60 42 102
30 – 40
55
Less than 40
102 55 157
40 – 50
70
Less than 50
157 70 227
50 – 60
53
Less than 60
227 53 280
60 – 70
20
Less than 70
280 20 300
More than type frequency distribution, with their
respective cumulative frequency is given by,
Age (in
years)
given
Number
of patients
i
f
Age (in years)
Cumulative
frequency
cf
0
More than or equal to 70
0
60 – 70
20
More than or equal to 60
0 20 20
50 – 60
53
More than or equal to 50
20 53 73
40 – 50
70
More than or equal to 40
73 70 143
30 – 40
55
More than or equal to 30
143 55 198
20 – 30
42
More than or equal to 20
198 42 240
10 – 20
60
More than or equal to 10
240 60 300
Question: 14
Given below is a cumulative frequency distribution
showing the marks secured by 50 students of a class:

Marks
Below 20
Below 40
Below 60
Below 80
Below 100
Number of
students
17
22
29
37
50
Form the frequency distribution table for the data.
Solution:
Class size
h 40 20 20
Class intervals with their respective frequency is given
by,
Marks
Cumulative
frequency
cf
Number of
students )
i
f
0 – 20
17
17 0 0
20 – 40
22
22 17 5
40 – 60
29
29 22 7
60 – 80
37
37 29 8
80 – 100
50
50 37 13
Question: 15
Weekly income of 600 families is tabulated below:
Weekly income (in Rs)
Number of families
0 – 1000
250
1000 – 2000
190
2000 – 3000
100

3000 – 4000
40
4000 – 5000
15
5000 – 6000
5
Total
600
Compute the median income.
Solution:
Class intervals with their respective cumulative
frequency is given by,
Weekly
income (in
Rs)
Number of families
Cumulative
frequency
cf
0 – 1000
250
250
1000 – 2000
190
250 190 440
2000 – 3000
100
440 100 540
3000 – 4000
40
540 40 580
4000 – 5000
15
580 15 595
5000 – 6000
5
595 5 600
From the table,
n 600
Cumulative frequency just greater than
cf
is 440, belonging to interval .
n 600
300
2 2
1000 2000

Median class
1000 2000
Lower limit of median class
l
1000
Class size
h 1000
Frequency of median class
f
190
Cumulative frequency of class preceding median
cf
class
250
Now, find the value of median.
n
cf
2
Median l h
f
300 250
1000 1000
190
50
1000 100
19
5000
1000
19
1000 263.15
1263.15
Hence, the median income of family is Rs 1263.15 per
week.
Question: 16

The maximum bowling speeds, in km per hour, of 33
players at a cricket coaching centre are given as
follows:
Speed (km/h)
85 – 100
100 – 115
115 – 130
130 – 145
Number of
players
11
9
8
5
Calculate the median bowling speed.
Solution:
Class intervals with their respective cumulative
frequency is given by,
Weekly
income (in
Rs)
Number of families
Cumulative
frequency
cf
85 – 100
11
11
100 – 115
9
11 9 20
115 – 130
8
20 8 28
130 – 145
5
28 5 33
From the table,
n 33
Cumulative frequency just greater than
cf
is 20, belonging to interval .
n 33
16.5
2 2
100 115

Median class
100 115
Lower limit of median class
l
100
Class size
h 15
Frequency of median class
f
9
Cumulative frequency of class preceding median
cf
class
11
Now, find the value of median.
n
cf
2
Median l h
f
16.5 11
100 15
9
5.5
100 15
9
5.5 5
100
3
100 9.166
109.166
Hence, the median bowling speed is 109.17 km/h.
Question: 17
The monthly income of 100 families are given as
below:

Income (in Rs)
Number of families
0 – 5000
8
5000 – 10000
26
10000 – 15000
41
15000 – 20000
16
20000 – 25000
3
25000 – 30000
3
30000 – 35000
2
35000 – 40000
1
Calculate the modal income.
Solution:
The maximum class frequency is 41 belonging to class
interval .
10000 15000
Modal class
10000 15000
Lower limit of modal class
l
10000
Frequency of modal class
1
f
41
Class size
h 5000
Frequency of class preceding the modal class
0
f
26
Frequency of class succeeding the modal class
2
f
16
Now, find the value of mode.

1 0
1 0 2
f f
Mode l h
2f f f
41 26
10000 5000
2 41 26 16
15
10000 5000
82 42
15
5000 2
40
95
5000
40
5000 2.375
11875
Hence, modal income is Rs 11875.
Question: 18
The weight of coffee in 70 packets are shown in the
following table:
Weight (in g)
Number of packets
200 – 201
12
201 – 202
26
202 – 203
20
203 – 204
9
204 – 205
2
205 – 206
1

Determine the modal weight.
Solution:
The maximum class frequency is 26 belonging to class
interval .
201 202
Modal class
201 202
Lower limit of modal class
l
201
Frequency of modal class
1
f
26
Class size
h 1
Frequency of class preceding the modal class
0
f
12
Frequency of class succeeding the modal class
2
f
20
Now, find the value of mode.
1 0
1 0 2
f f
Mode l h
2f f f
26 12
201 1
2 26 12 20
14
201
52 32
14
201
20
201 0.7
201.7
Hence, the modal weight is 201.7 g.

Question: 19
Two dice are thrown at the same time. Find the
probability of getting
(i) same number on both dice
(ii) different numbers on both dice
Solution:
The total number of all possible outcomes if two dice
are thrown at the same time are 36.
(i) All the favourable outcomes are (1, 1), (2, 2), (3, 3),
(4, 4), (5, 5), (6, 6).
So, total number of favourable outcomes
6
6
36
1
6
(ii) Probability of getting different number on both
the dice Probability of getting same number
1
on both the dice
Probability
1
1
6
5
6
Thus, the probability is .
5
6

Question: 20
Two dice are thrown simultaneously. What is the
probability that the sum of the numbers appearing on
the dice is:
(i) 7?
(ii) a prime number?
(iii) 1?
Solution:
The total number of all possible outcomes if two dice
are thrown at the same tine are 36.
(i) The sum of the numbers appearing on both dice
is 7:
The pairs which are favourable are (1, 6), (2, 5), (3,
4), (4, 3), (5, 2) and (6, 1).
So, the number of favourable events are 6.
favourableNumber of outcomes
Number of to
P
t
ro
al
babi
outc
li
s
ty
ome
6
36
1
6
(ii) The probability that the sum of the numbers
appearing on the dice is a prime number:

The pairs which are favourable are (1, 1), (1, 2), (1,
4), (1, 6), (2, 1), (2, 3), (2, 5), (3, 2), (3, 4), (4, 1), (4,
3), (5, 2), (5, 6), (6, 1) and (6, 5).
The number of favourable events are 15.
favourableNumber of outcomes
Number of to
P
t
ro
al
babi
outc
li
s
ty
ome
15
36
5
12
(iii) Sum of the numbers appearing on the dice is 1:
The number of favourable events is 0.
favourableNumber of outcomes
Number of to
P
t
ro
al
babi
outc
li
s
ty
ome
0
36
0
Question: 21
Two dice are thrown together. Find the probability
that the product of the numbers on the top of the dice
is:
(i) 6
(ii) 12

(iii) 7
Solution:
The total number of all possible outcomes if two dice
are thrown at the same time are 36.
favourableNumber of outcomes
Number of to
P
t
ro
al
babi
outc
li
s
ty
ome
(i) The favourable outcomes are (1, 6), (2, 3), (3, 2),
(6,1).
Number of favourable outcomes 4.
So,
Probability
4
36
1
9
(ii) The favourable outcomes are (2, 6), (3, 4), (4, 3), (6,
2)
Number of favourable outcomes 4.
So,
Probability
4
36
1
9
(iii) Number of favourable outcomes is 0.

So,
Probability
0
36
0
Question: 22
Two dice are thrown at the same time and the product
of numbers appearing on them is noted. Find the
probability that the product is less than 9.
Solution:
The total number of all possible outcomes if two dice
are thrown at the same time are 36.
The favourable outcomes are (1, 1), (1, 2), (1, 3), (1, 4),
(1, 5), (1, 6), (2, 1), (2, 2), (2, 3), (2, 4), (3, 1), (3, 2), (4, 1),
(4, 2), (5, 1), (6, 1).
Number of favourable outcomes 16.
favourableNumber of outcomes
Number of to
P
t
ro
al
babi
outc
li
s
ty
ome
16
36
4
9
Thus, the probability is given by .
4
9

Question: 23
Two dice are numbered 1, 2, 3, 4, 5, 6 and 1, 1, 2, 2, 3, 3,
respectively. They are thrown and the sum of the
numbers on them is noted. Find the probability of
getting each sum from 2 to 9 separately.
Solution:
The total number of all possible outcomes if two dice
are thrown at the same time are 36.
favourableNumber of outcomes
Probability
Number of total outcomes
(i) The favourable outcomes when sum of numbers
on two dice is 2 are (1, 1), (1, 1).
Number of favourable outcomes are 2.
So,
2
Probability
36
1
18
(ii) The favourable outcomes when sum of numbers
on two dice is 3 are (1, 2), (1, 2), (2, 1), (2, 1).
Number of favourable outcomes 4.
So,
4
Probability
36

1
9
(iii) The favourable outcomes when sum of numbers
on two dice is 4 are (1, 3), (1, 3), (2, 2), (2, 2), (3, 1),
(3, 1).
Number of favourable outcomes 6.
So,
6
Probability
36
1
6
(iv) The favourable outcomes when sum of numbers
on two dice is 5 are (2, 3), (2, 3), (3, 2), (3, 2), (4, 1),
(4, 1).
Number of favourable outcomes 6.
So,
6
Probability
36
1
6
(v) The favourable outcomes when sum of numbers
on two dice is 6 are (3, 3), (3, 3), (4, 2), (4, 2), (5, 1),
(5, 1).

Number of favourable outcomes 6.
So,
6
Probability
36
1
6
(vi) The favourable outcomes when sum of numbers
on two dice is 7 are (4, 3), (4, 3), (5, 2), (5, 2), (6, 1),
(6, 1).
Number of favourable outcomes 6.
So,
6
Probability
36
1
6
(vii) The favourable outcomes when sum of numbers
on two dice is 8 are (5, 3), (5, 3), (6, 2), (6, 2).
Number of favourable outcomes 4.
So,
4
Probability
36
1
9
(viii) The favourable outcomes when sum of numbers
on two dice is 9 are (6, 3), (6, 3).

Number of favourable outcomes 2.
So,
2
Probability
36
1
18
Question: 24
A coin is tossed two times. Find the probability of
getting at most one head.
Solution:
Let us consider, H for heads and T for tails.
Total outcomes are (HH), (HT), (TH), (TT).
Favourable outcomes are (HT), (TH), (TT).
Number of favourable outcomes 3
Num
Pro
ber
babili
of favo
ty of getting
urableoutcomes
Number of total outcom
a
es
t most one head
3
4
Thus, the probability is given by .
3
4
Question: 25
A coin is tossed 3 times. List the possible outcomes.
Find the probability of getting

(i) all heads
(ii) at least 2 heads
Solution:
Let us consider, H for heads and T for tails.
Total outcomes are (HHH), (HHT), (HTH), (THH),
(TTT), (TTH), (THT), (HTT).
So, total number of possible outcomes
8
(i) Favourable outcomes are (HHH).
Number of favourable outcomes
1
favourableNumber of outcomes
Number of to
P
t
ro
al
babi
outc
li
s
ty
ome
1
8
(ii) Favourable outcomes are (HHH), (HHT), (HTH),
(THH)
Total number of favourable outcomes are 4
favourableNumber of outcomes
Probability
Number of total outcomes
4
8
1
2

Thus, the probability is given by .
1
2
Question: 26
Two dice are thrown at the same time. Determine the
probability that the difference of the numbers on the
two dice is 2.
Solution:
The total number of all possible outcomes if two dice
are thrown at the same time are 36.
Favourable outcomes of getting the difference of the
numbers as is (1, 3), (2, 4), (3, 5), (4, 6), (3, 1), (4, 2),
2
(5, 3), (6, 4).
Total number of favourable outcomes
8
favourableNumber of outcomes
Number of to
P
t
ro
al
babi
outc
li
s
ty
ome
8
36
2
9
Thus, the probability is given by .
2
9
Question: 27

A bag contains 10 red, 5 blue and 7 green balls. A ball
is drawn at random. Find the probability of this ball
being a
(i) red ball
(ii) green ball
(iii) not a blue ball
Solution:
Number of red balls
10
Number of blue balls
5
Number of green balls
7
Total number of balls (total number of
10 5 7 22
outcomes)
(i) Number of favourable outcomes
10
favourableNumber of outcomes
Number of to
P
t
ro
al
babi
outc
li
s
ty
ome
10
22
(ii) Number of favourable outcomes
7
favourableNumber of outcomes
Number of to
P
t
ro
al
babi
outc
li
s
ty
ome
7
22

(iii) Number of favourable outcomes
22 5 17
(total number of balls except blue balls)
favourableNumber of outcomes
Number of to
P
t
ro
al
babi
outc
li
s
ty
ome
17
22
Question: 28
The king, queen and jack of clubs are removed from a
deck of 52 playing cards and then well shuffled. Now
one card is drawn at random from the remaining
cards. Determine the probability that the card is:
(i) a heart
(ii) a king
Solution:
Total number of cards in a deck 52.
Total number of cards after removing King, Queen
and Jack of club (number of outcomes)
52 3 49
(i) Number of favourable outcomes of getting a card
of heart
13
favourableNumber of outcomes
Number of to
P
t
ro
al
babi
outc
li
s
ty
ome

13
49
(ii) Number of favourable outcomes of getting a card
of King
3
favourableNumber of outcomes
Number of to
P
t
ro
al
babi
outc
li
s
ty
ome
3
49
Question: 29
Refer to Q.28. What is the probability that the card is:
(i) a club
(ii) 10 of hearts
Solution:
Total number of cards in a deck
52
Total number of cards after removing King, Queen
and Jack of club (number of outcomes)
52 3 49
(i) Number of favourable outcomes of getting a card
of club
13 3 10
favourableNumber of outcomes
Number of to
P
t
ro
al
babi
outc
li
s
ty
ome

10
49
(ii) Number of favourable outcomes of getting 10 of
heart
1
favourableNumber of outcomes
Number of to
P
t
ro
al
babi
outc
li
s
ty
ome
1
49
Question: 30
All the jacks, queens and kings are removed from a
deck of 52 playing cards. The remaining cards are well
shuffled and then one card is drawn at random.
Giving ace a value 1, similar value for other cards, find
the probability that the card has a value
(i) 7
(ii) greater than 7
(iii) less than 7
Solution:
Total number of cards in a deck
52
According to the question,

Total number of cards after removing 4 Kings, 4
Queens and 4 Jacks (number of
52 12 40
outcomes)
Now, ace has been given value 1, and similar value for
other cards. So, all the four aces are numbered as 1.
(i) Number of favourable outcomes of getting a card
that has a value
7 4
favourableNumber of outcomes
Number of to
P
t
ro
al
babi
outc
li
s
ty
ome
4
40
1
10
(ii) 8, 9 and 10.are the numbers which are greater
than 7.
Number of favourable outcomes of getting a card
that has a value of greater than
7 3 4 12
favourableNumber of outcomes
Number of to
P
t
ro
al
babi
outc
li
s
ty
ome
12
40

3
10
(iii) 1, 2, 3, 4, 5 and 6.are the numbers which are less
than 7.
Number of favourable outcomes of getting a card
that has a value of less than
7 6 4 24
favourableNumber of outcomes
Number of to
P
t
ro
al
babi
outc
li
s
ty
ome
24
40
3
5
Question: 31
An integer is chosen between 0 and 100. What is the
probability that it is:
(i) divisible by 7?
(ii) not divisible by 7?
Solution:
Total number of integers between 99.
0and100
(i) Numbers between 0 and 100 divisible by 7 are 7,
14, 21, 28, 35, 42, 49, 56, 63, 70, 77, 84, 91 and 98.
Number of favourable outcomes
14

favourableNumber of outcomes
Number of to
P
t
ro
al
babi
outc
li
s
ty
ome
14
99
(ii) Numbers between 0 and 100 not divisible by 7 are
Number between and divisible by
99
0
100
7
Number of favourable outcomes
99 14 85
favourableNumber of outcomes
Number of to
P
t
ro
al
babi
outc
li
s
ty
ome
85
99
Question: 32
Cards with numbers 2 to 101 are placed in a box. A
card is selected at random. Find the probability that
the card has
(i) an even number
(ii) a square number
Solution:
Total number of cards are (total
101 1 100
outcomes)
(i) Total number of even number cards
50
Number of favourable outcomes
50

favourableNumber of outcomes
Number of to
P
t
ro
al
babi
outc
li
s
ty
ome
50
100
1
2
(ii) Total square numbers from 2 to 101 are 4, 9, 16,
25, 36, 49, 64, 81, 100.
Number of favourable outcomes
9
favourableNumber of outcomes
Number of to
P
t
ro
al
babi
outc
li
s
ty
ome
9
100
Question: 33
A letter of English alphabets is chosen at random.
Determine the probability that the letter is a
consonant.
Solution:
Total number of English alphabets (number of
26
outcomes)
Total number of vowels (a, e, i, o, u)
5
So, total number of consonants
26 5 21

Number of favourable outcomes
21
favourableNumber of outcomes
Number of to
P
t
ro
al
babi
outc
li
s
ty
ome
21
26
Thus, the probability is given by .
21
26
Question: 34
There are 1000 sealed envelopes in a box, 10 of them
contain a cash prize of Rs 100 each, 100 of them
contain a cash prize of Rs 50 each and 200 of them
contain a cash prize of Rs 10 each and rest do not
contain any cash prize. If they are well shuffled and
an envelope is picked up out, what is the probability
that it contains no cash prize?
Solution:
According to the question,
Total number of sealed envelopes in a box
1000
Number of envelopes containing cash prize of Rs 100
each
10
Number of envelopes containing cash prize of Rs 50
each
100

Number of envelopes containing cash prize of Rs 10
each
200
So, total number of envelopes containing cash prize
10 100 200 310
Now, number of envelopes containing no cash prize
(favourable outcome)
1000 310 690
favourableNumber of outcomes
Number of to
P
t
ro
al
babi
outc
li
s
ty
ome
690
1000
69
100
Thus, the probability is given by .
69
100
Question: 35
Box A contains 25 slips of which 19 are marked Re 1
and other are marked Rs 5 each. Box B contains 50
slips of which 45 are marked Re 1 each and others are
marked Rs 13 each. Slips of both boxes are poured into
a third box and reshuffled. A slip is drawn at random.
What is the probability that it is marked other than
Re 1?

Solution:
Total number of slips in box A
25
Total number of slips in box B
50
So, total number of outcomes (slips
25 50 75
poured in third box)
The total number of slips in third box marked as Re
(favourable outcome)
1 19 45 64
Now, the total number of slips in third box marked
other than Re
1 75 64 11
favourableNumber of outcomes
Number of to
P
t
ro
al
babi
outc
li
s
ty
ome
11
75
Thus, the probability is given by .
11
75
Question: 36
A carton of 24 bulbs contain 6 defective bulbs. One
bulb is drawn at random. What is the probability that
the bulb is not defective? If the bulb selected is
defective and it is not replaced and a second bulb is
selected at random from the rest, what is the
probability that the second bulb is defective?

Solution:
Total number of bulbs in a carton (total
24
outcomes)
Number of defective bulbs
6
Total number of favourable outcomes of drawing a
bulb which is not defective
24 6 18
favourableNumber of outcomes
Probability
Number of total outcomes
18
24
3
4
Now, the bulb selected is defective and is not replaced.
So, the total number of remaining bulbs
24 1 23
So, number of favourable outcomes of drawing a
second bulb which is defective
6 1 5
favourableNumber of outcomes
Number of to
P
t
ro
al
babi
outc
li
s
ty
ome
5
23
Thus, the probability is given by .
5
23
Question: 37

A child’s game has 8 triangles of which 3 are blue and
rest are red, and 10 squares of which 6 are blue and
rest are red. One piece is lost at random. Find the
probability that it is a
(i) triangle
(ii) square
(iii) square of blue colour
(iv) triangle of red colour
Solution:
Total number of triangles in the game
8
Number of blue triangles
3
Number of red triangles
8 3 5
Total number of squares
10
Number of blue squares
6
Number of red triangles
10 6 4
Total number of pieces (total number of
8 10 18
outcomes)
(i) Number of favourable outcomes
8
favourableNumber of outcomes
Number of to
P
t
ro
al
babi
outc
li
s
ty
ome
8
18

4
9
Thus, probability is given by .
4
9
(ii) Number of favourable outcomes
10
favourableNumber of outcomes
Number of to
P
t
ro
al
babi
outc
li
s
ty
ome
10
18
5
9
Thus, probability is given by .
5
9
(iii)Number of favourable outcomes
6
favourableNumber of outcomes
Number of to
P
t
ro
al
babi
outc
li
s
ty
ome
6
18
1
3
Thus, probability is given by .
1
3

(iv) Number of favourable outcomes
5
favourableNumber of outcomes
Number of to
P
t
ro
al
babi
outc
li
s
ty
ome
5
18
Thus, probability is given by .
5
18
Question: 38
In a game, the entry fee is Rs 5. The game consists of a
tossing a coin 3 times. If one or two heads show,
Sweta gets her entry fee back. If she throws 3 heads,
she receives double the entry fees. Otherwise she will
lose. For tossing a coin three times, find the
probability that she
(i) loses the entry fee
(ii) gets double entry fee
(iii) just gets her entry fee.
Solution:
Let us consider, H for heads and T for tails.
Total outcomes are (HHH), (HHT), (HTH), (THH),
(TTT), (TTH), (THT), (HTT).
So, total number of possible outcomes
8

(i) Favourable outcome is (TTT).
Total number of favourable outcome 1
favourableNumber of outcomes
Number of to
P
t
ro
al
babi
outc
li
s
ty
ome
1
8
Thus, probability is given by .
1
8
(ii) Favourable outcome is (HHH).
Total number of favourable outcome 1
favourableNumber of outcomes
Number of to
P
t
ro
al
babi
outc
li
s
ty
ome
1
8
Thus, probability is given by .
1
8
(iii)Favourable outcome is (HHT), (HTH), (THH),
(TTH), (THT), (HTT).
Total number of favourable outcome 6
favourableNumber of outcomes
Number of to
P
t
ro
al
babi
outc
li
s
ty
ome
6
8

3
4
Thus, probability is given by .
3
4
Question: 39
A die has its six faces marked 0, 1, 1, 1, 6, 6. Two such
dice are thrown together and the total score is
recorded.
(i) How many different scores are possible?
(ii) What is the probability of getting a total of 7?
Solution:
The total number of all possible outcomes if two dice
are thrown at the same time are 36.
(i) The total outcomes are (0, 0), (0, 1), (0, 6), (1, 0),
(1, 1), (1, 6), (6, 0), (6, 1), (6, 6).
So, the total number of favourable outcomes
9
On adding the two numbers, following scores are
possible, i.e. 0, 1, 6, 2, 7, 12.
Thus, 6 different scores are possible.
(ii) Number of favourable outcomes
2

The total number of all possible outcomes of
getting the sum either
0,1,2,6,7and12 6
favourableNumber of outcomes
Number of to
P
t
ro
al
babi
outc
li
s
ty
ome
2
6
1
3
Thus, probability is given by .
1
3
Question: 40
A lot consists of 48 mobile phones of which 42 are
good, 3 have only minor defects and 3 have major
defects. Varnika will buy a phone if it is good but the
trader will only buy a mobile if it has no major defect.
One phone is selected at random from the lot. What is
the probability that it is 174
(i) acceptable to Varnika?
(ii) acceptable to the trader?
Solution:
The total number of mobile phones in the lot
48
(i) Total number of favourable outcomes are 42
(good phones).

42
48
21
24
7
8
Thus, probability is given by .
7
8
(ii) Number of phones with no major defects
48 3 45
So, the total number of favourable outcomes are
45 (phones without major defects).
favourableNumber of outcomes
Number of to
P
t
ro
al
babi
outc
li
s
ty
ome
45
48
15
16
Thus, probability is given by .
15
16
Question: 41

A bag contains 24 balls of which are red, are
x
2x
white and are blue. A ball is selected at random.
3x
What is the probability that it is
(i) not red?
(ii) white?
Solution:
The total number of balls in a bag (total
24
outcomes)
Total number of red balls
x
Total number of white balls
2x
Total number of blue balls
3x
So, total number of balls are given by,
24 x 2x 3x
6x 24
24
x
6
x 4
Now, Total number of red balls
x 4
Total number of white balls
2x 2 4 8
Total number of blue balls
3x 3 4 12
(i) Total number of favourable outcomes
(number of balls except red)
24 4 20

favourableNumber of outcomes
Number of to
P
t
ro
al
babi
outc
li
s
ty
ome
20
24
5
6
Thus, probability is given by .
5
6
(ii) Total number of favourable outcomes
8
(number of white balls)
favourableNumber of outcomes
Number of to
P
t
ro
al
babi
outc
li
s
ty
ome
8
24
1
3
Thus, probability is given by .
1
3
Question: 42
At a fete, cards bearing numbers 1 to 1000, one
number on one card, are put in a box. Each player
selects one card at random and that card is not

replaced. If the selected card has a perfect square
greater than 500, the player wins a prize. What is the
probability that
(i) the first player wins a prize?
(ii) the second player wins a prize, if the first has
won?
Solution:
The total number of cards (total outcomes)
1000
The perfect squares greater than 500 are 529, 576, 625,
676, 729, 784, 841, 900, 961
2
23 ,
2
24 ,
2
25 ,
2
26 ,
2
27 ,
2
28 ,
2
29 ,
2
30 ,
2
31
(i) Total number of favourable outcome (number
9
of white balls)
favourableNumber of outcomes
Number of to
P
t
ro
al
babi
outc
li
s
ty
ome
9
1000
Thus, probability is given by .
9
1000
(ii) For the player, total number of cards
2nd
(total outcomes)
1000 1 999

Now, according to the question, the first player has
already won the prize. So, cards having perfect square
greater than
500 9 1 8
Total number of favourable outcome
8
favourableNumber of outcomes
=
Number of tot
Pro
al o
babil
utc
ity
omes
8
999
Thus, probability is given by .
8
999
Exercise 13.4 (14)
Question: 1
Find the mean marks of students for the following
distribution:
Marks
Number of students
0 and above
10 and above
20 and above
30 and above
40 and above
50 and above
60 and above
80
77
72
65
55
43
28

70 and above
80 and above
90 and above
100 and above
16
10
8
0
Solution:
First, find the class mark for each interval. For
i
x
this, the following relation should be used.
i
Upper limit Lower limit
x
2
Take assumed mean and calculate and
a 55
i
d
i i
fd
as follows.
Marks
Number of
students
cf
Class
marks
i
x
i i
d x 55
i
f
i i
fd
0 and above
80
0 – 10
5
50
80 77 3
150
10 and above
77
10 – 20
15
40
77 72 5
200
20 and above
72
20 – 30
25
30
72 65 7
210
30 and above
65
30 – 40
35
20
65 55 10
200
40 and above
55
40 – 50
45
10
55 43 12
120
50 and above
43
50 – 60
55
0
43 28 15
0
60 and above
28
60 – 70
65
10
28 16 12
120

70 and above
16
70 – 80
75
20
16 10 6
120
80 and above
10
80 – 90
85
30
10 8 2
60
90 and above
8
90 –
100
95
40
8 0 8
320
100 and above
0
100 –
110
105
50
0
0
Total
80
i
f
i i
fd
260
From the table,
Now, find the value of mean.
i i
i
fd
x a
f
260
55
80
13
55
4
55 3.25
51.75
Hence, mean of students is 51.75.
Question: 2
Determine the mean of the following distribution:
Marks
Number of students

Below 10
Below 20
Below 30
Below 40
Below 50
Below 60
Below 70
Below 80
Below 90
Below 100
5
9
17
29
45
60
70
78
83
85
Solution:
First, find the class mark for each interval. For
i
x
this, the following relation should be used.
i
Upper limit Lower limit
x
2
Class size
h 10
Take assumed mean and calculate and
a 45
i
d ,
i
u
i i
fu
as follows.
Marks
Number
of
students
Class
marks
i
x
i i
d x 45
i
i
d
u ,
h
h 10
i
f
i i
fu

cf
Below 10
5
0 – 10
5
40
4
5 0 5
20
Below 20
9
10 – 20
15
30
3
9 5 4
12
Below 30
17
20 – 30
25
20
2
17 9 8
16
Below 40
29
30 – 40
35
10
1
29 17 12
12
Below 50
45
40 – 50
45
0
0
45 29 16
0
Below 60
60
50 – 60
55
10
1
60 45 15
15
Below 70
70
60 – 70
65
20
2
70 60 10
20
Below 80
78
70 – 80
75
30
3
78 70 8
24
Below 90
83
80 – 90
85
40
4
83 78 5
20
Below 100
85
90 – 100
95
50
5
85 83 2
10
Total
85
29
From the table,
and
i
f 85
i i
fu 29
Now, find the value of mean.
i i
i
fu
x a h
f
29
45 10
85

290
45
85
45 3.41
48.41
Hence, the mean marks are 48.41.
Question: 3
Find the mean age of 100 residents of a town from the
following data:
Age equal and above (in years)
0
10
20
30
40
50
60
70
Number of persons
100
90
75
50
25
15
5
0
Solution:
First, find the class mark for each interval. For
i
x
this, the following relation should be used.
i
Upper limit Lower limit
x
2
Class size
h 10
Take assumed mean and calculate and
a 35
i
d ,
i
u
i i
fu
as follows.
Age
Number of
persons
Class
marks
i
x
i i
d x 35
i
i
d
u ,
h
h 10
i
f
i i
fu

cf
equal and
above 0
100
0 – 10
5
30
3
100 90 10
30
equal and
above 10
90
10 – 20
15
20
2
90 75 15
30
equal and
above 20
75
20 – 30
25
10
1
75 50 25
25
equal and
above 30
50
30 – 40
35
0
0
50 25 25
0
equal and
above 40
25
40 – 50
45
10
1
25 15 10
10
equal and
above 50
15
50 – 60
55
20
2
15 5 10
20
equal and
above 60
5
60 – 70
65
30
3
5 0 5
15
equal and
above 70
0
From the table,
and
i
f 100
i i
fu 40
Now, find the Mean.
i i
i
fu
x a h
f
40
35 10
100
35 4
31

Hence, mean age of hundred persons is 31.
Question: 4
The weights of tea in 70 packets are shown in the
following table:
Weight (in gram)
Number of packets
200 – 201
201 – 202
202 – 203
203 – 204
204 – 205
205 – 206
13
27
18
10
1
1
Find the mean weight of packets.
Solution:
First, find the class mark for each interval. For
i
x
this, the following relation should be used.
i
Upper limit Lower limit
x
2
Take assumed mean and calculate and
a 202.5
i
d
as follows.
i i
fd
Weight (in
gram)
Number of
packets
i
f
i
x
i i
d x 202.5
i i
fd

200 – 201
13
200.5
2
26
201 – 202
27
201.5
1
27
202 – 203
18
202.5
0
0
203 – 204
10
203.5
1
10
204 – 205
1
204.5
2
2
205 – 206
1
205.5
3
3
Total
70
i
f
i i
fd 38
From the table,
Now, find the value of mean.
i i
i
fd
x a
f
38
202.5
70
202.5 0.542
201.958
Thus, the mean weight of packets is 201.96.
Now, the points for less than type ogive are given by,
A(200, 0), B(201, 13), C(202, 40), D(203, 58), E(204, 68),
F(205, 69), G(206, 70).
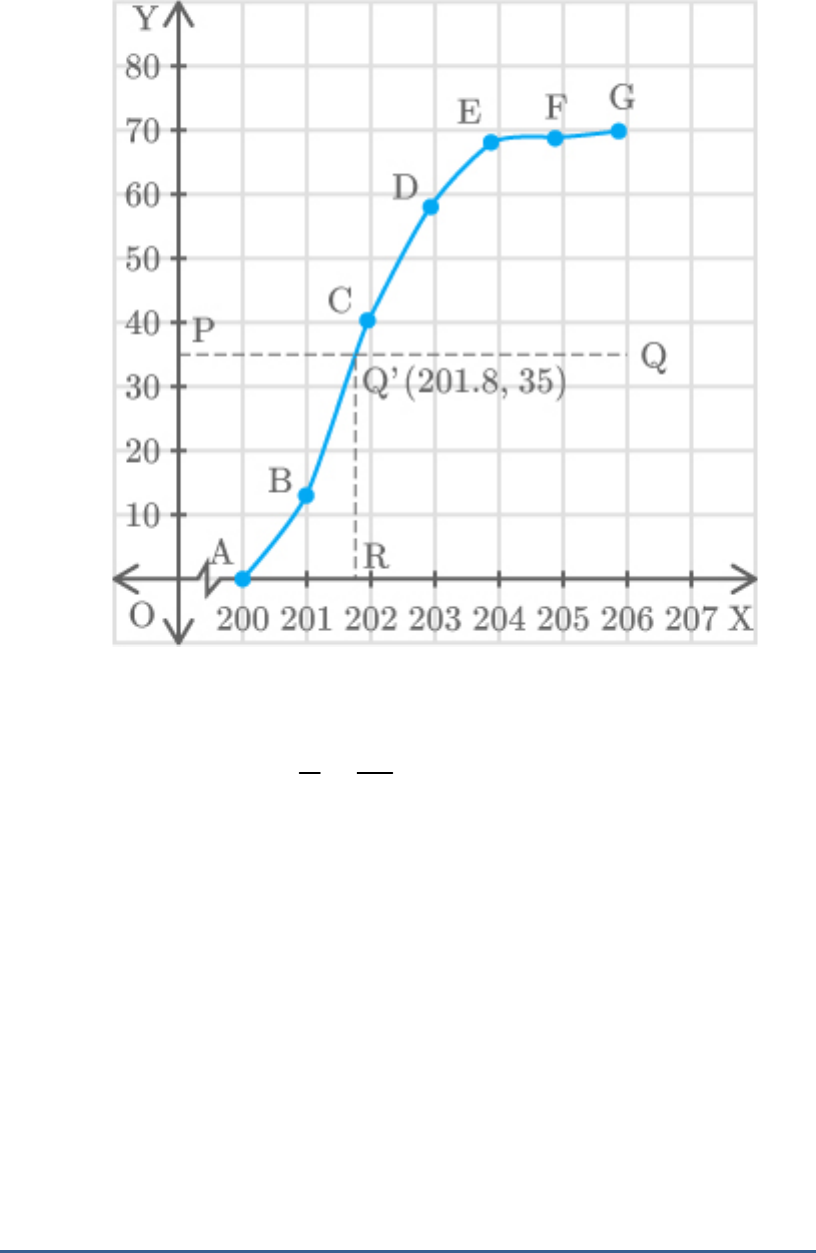
Now, from the graph, find the median.
For this, let us take at the axis and
n 70
35
2 2
y
draw a line PQ parallel to axis.
x
And, it meets the plotted graph at .
Q
Also, draw a line perpendicular to axis.
Q R
x
This meets on axis at the point 201.8 which is the
x
median of the given data.
Question: 5
Refer to Q.4 above. Draw the less than type ogive for
this data and use it to find the median weight.

Solution:
Class intervals with their respective cumulative
frequency is given by,
Weight (in
gram)
Number of
packets
i
f
Weight
Cumulative
frequency
cf
Less than 200
0
200 – 201
13
Less than 201
13 0 13
201 – 202
27
Less than 202
13 27 40
202 – 203
18
Less than 203
40 18 58
203 – 204
10
Less than 204
58 10 68
204 – 205
1
Less than 205
68 1 69
205 – 206
1
Less than 206
69 1 70
From the table,
n 70
Cumulative frequency just greater than
cf
is 40, belonging to interval .
n 70
35
2 2
201 202
Median class
201 202
Lower limit of median class
l
201
Class size
h 1
Frequency of median class
f
27

Cumulative frequency of class preceding median
cf
class
13
Now, find the median.
n
cf
2
Median l h
f
35 13
201 1
27
22
201
27
201 0.814
201.814
Hence, the median weight is 201.814 g.
Question: 6
Refer to Q.4 above. Draw the less than type and more
than type ogives for the data and use them to find the
median weight.
Solution:
Class intervals with their respective cumulative
frequency is given by,
Weight
Number
Weight
Cumulative
Points for Iess

(in gram)
of packets
i
f
frequency less
than type
cf
– than type
ogive
Less than 200
0
A
200,0
200 – 201
13
Less than 201
13 0 13
B
201,13
201 – 202
27
Less than 202
13 27 40
C
202,40
202 – 203
18
Less than 203
40 18 58
D
203,58
203 – 204
10
Less than 204
58 10 68
E
204,68
204 – 205
1
Less than 205
68 1 69
F
205,69
205 – 206
1
Less than 206
69 1 70
G
206,70
Class intervals with their respective cumulative
frequency is given by,
Weight
Cumulative
frequency more than
type
cf
Points for more
– than type
ogive
More than or equal to 200
70
H
200,70
More than or equal to 201
70 13 57
I
201,57
More than or equal to 202
57 27 30
J
202,30
More than or equal to 203
30 18 12
K
203,12
More than or equal to 204
12 10 2
L
204,2
More than or equal to 205
2 1 1
M
205,1
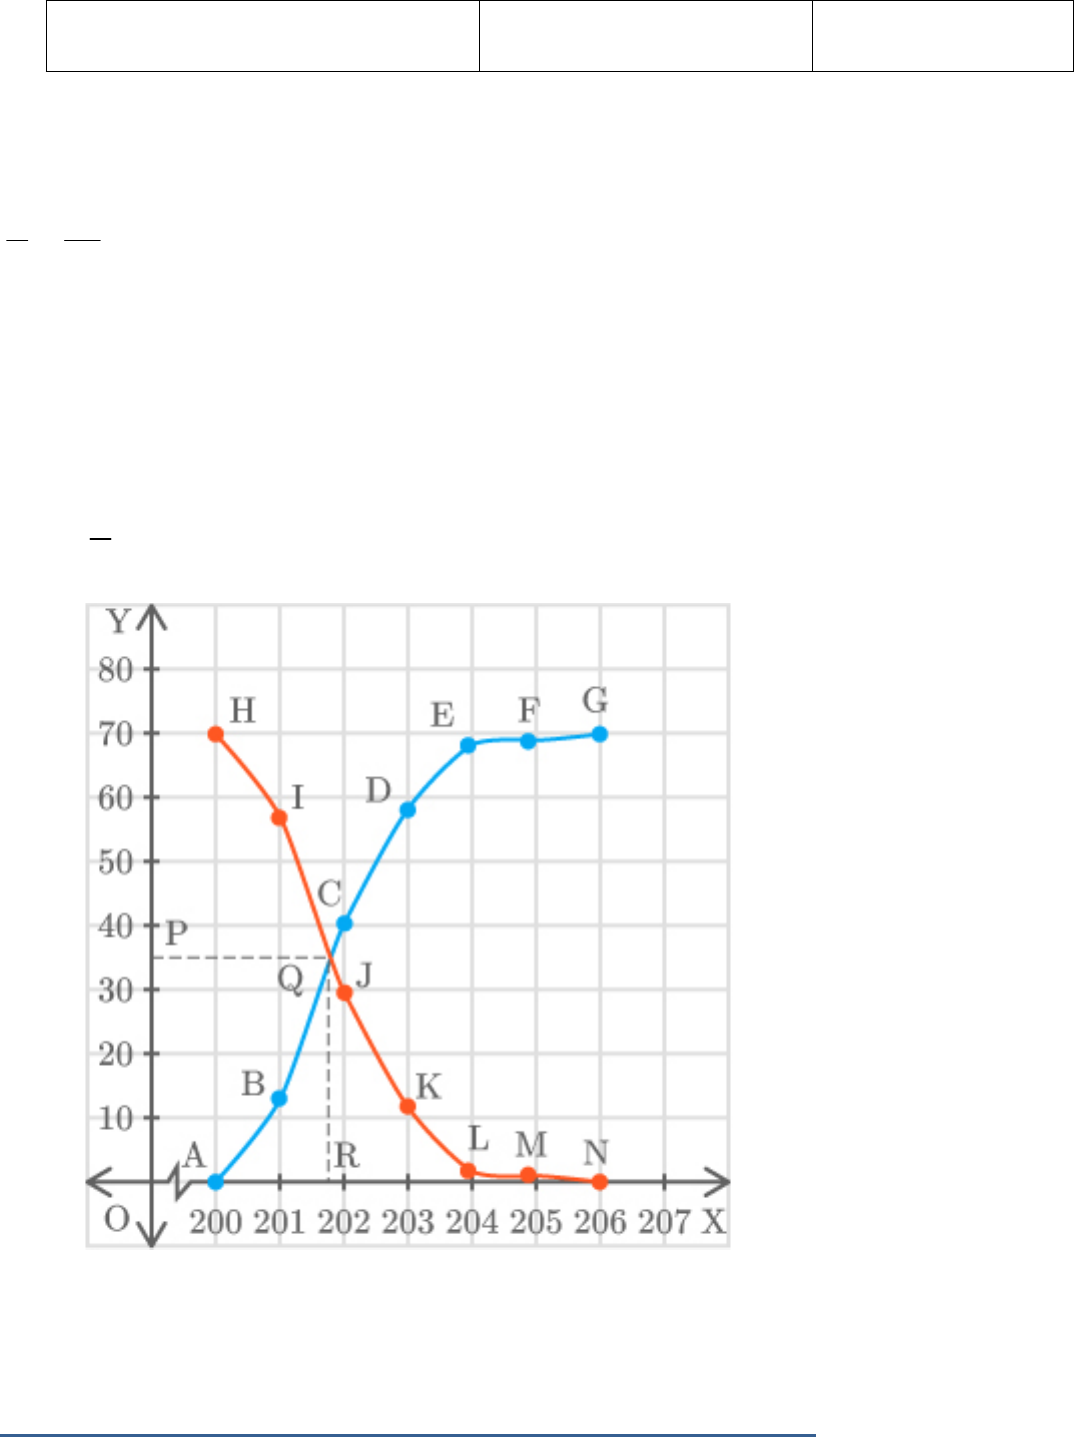
More than or equal to 206
1 1 0
N
206,0
Now,
n 70
n 70
35
2 2
The class intervals are taken on axis and
x
cumulative frequency is taken on axis. The
y
intersection point of less than and more than o give
gives on the axis and median on the axis.
n
2
y
x
Hence, the median weight of packets is 201.8 g.
Question: 7

The table below shows the salaries of 280 persons.
Salary (in thousands (Rs))
Number of persons
5 – 10
10 – 15
15 – 20
20 – 25
25 – 30
30 – 35
35 – 40
40 – 45
45 – 50
49
133
63
15
6
7
4
2
1
Calculate the median and mode of the data.
Solution:
Class intervals with their respective cumulative
frequency is given by,
Salary (in
thousands (Rs))
Number of
lamps
i
f
Cumulative
frequency
cf
5 – 10
49
49
10 – 15
133
49 133 182
15 – 20
63
182 63 245
20 – 25
15
245 15 260
25 – 30
6
260 6 266

30 – 35
7
266 7 273
35 – 40
4
273 4 277
40 – 45
2
277 2 279
45 – 50
1
279 1 280
From the table,
n 280
Cumulative frequency just greater than
cf
is 182, belonging to interval .
n 280
140
2 2
10 15
Median class
10 15
Lower limit of median class
l
10
Class size
h 5
Frequency of median class
f
133
Cumulative frequency of class preceding median
cf
class
49
Now, find the median.
n
cf
2
Median l h
f
140 49
10 5
133

91 5
10
133
455
10
133
10 3.421
13.421(in1000Rs)
Median of data
13.421 1000 Rs13421
Now, the maximum class frequency is 133 belonging
to class interval .
10 15
Modal class
10 15
Lower limit of modal class
l
10
Frequency of modal class
1
f
133
Class size
h 5
Frequency of class preceding the modal class
0
f
49
Frequency of class succeeding the modal class
2
f
63
Now, find the mode.
1 0
1 0 2
f f
Mode l h
2f f f
133 49
10 5
2 133 49 63
84
10 5
154
6 5
10
11

30
10
11
10 2.727
12.727(in1000Rs)
Mode
12.727 1000
Rs12727
Hence, the median and mode of the salaries are Rs
13,421 and Rs 12,727 respectively.
Question: 8
The mean of the following frequency distribution is
50, but the frequencies and in classes 20 – 40 and
1
f
2
f
60 – 80, respectively are not known. Find these
frequencies, if the sum of all the frequencies is 120.
Class
0 – 20
20 – 40
40 – 60
60 – 80
80 – 100
Frequency
17
1
f
32
2
f
19
Solution:
Given: Mean
50
First, find the class mark for each interval. For
i
x
this, the following relation should be used.
i
Upper limit Lower limit
x
2

Take assumed mean and calculate and as
a 30
i
d
i i
fd
follows.
Class
Frequency
i
f
i
x
i i
d x 30
i i
fd
0 – 20
17
10
20
340
20 – 40
1
f
30
0
0
40 – 60
32
50
20
640
60 – 80
2
f
70
40
2
40f
80 – 100
19
90
60
1140
Total
120
i
f
i i 2
fd 1440 40f
From the table,
Mean is given by,
x
i i
i
fd
x a
f
2
1440 40f
50 30
120
2
1440 40f
50 30
120 120
2
f
20 12
3
2
f
20 12
3

2
f
8
3
2
f 24
Now, adding all the frequencies together.
1 2
17 f 32 f 19 120
1 2
68 f f 120
1
68 f 24 120
1
f 120 92
1
f 28
Hence, and
1
f 28
2
f 24
Question: 9
The median of the following data is 50. Find the values
of , if the sum of all the frequencies is 90.
p and q
Marks
Frequency
20 – 30
30 – 40
40 – 50
50 – 60
60 – 70
70 – 80
80 – 90
p
15
25
20
q
8
10

Solution:
Given: Median of observations
50
And, sum of frequencies
90
Marks
Frequency
i
f
Cumulative frequency
cf
20 – 30
p
p
30 – 40
15
p 15
40 – 50
25
p 15 25
50 – 60
20
p 40 20
60 – 70
q
p 60 q
70 – 80
8
p 60 q 8
80 – 90
10
p q 78
From the table,
(given)
p q 78 90
So,
p q 12
n 90
Now, median is 50, belonging to interval .
50 60
Median class
50 60
Lower limit of median class
l
50
Class size
h 10
Frequency of median class
f
20

Cumulative frequency of class preceding median
cf
class
40 p
Now, the formula for median is given by,
n
cf
2
Median l h
f
90
40 p
2
50 50 10
20
45 40 p
50 50 10
20
45 40 p
0
2
0 5 p
p 5
Now,
p q 12
5 q 12
q 12 5
q 7
Hence, and
p 5
q 7
Question: 10
The distribution of heights (in cm) of 96 children is
given below:
Height (in cm)
Number of children

124 – 128
128 – 132
132 – 136
136 – 140
140 – 144
144 – 148
148 – 152
152 – 156
156 – 160
160 – 164
5
8
17
24
16
12
6
4
3
1
Draw a less than type cumulative frequency curve for
this data and use it to compute median height of the
children.
Solution:
Class intervals with their respective cumulative
frequency is given by,
Height
Number of
children
cf
Points for Iess –
than type ogive
Less than 124
0
A
124,0
Less than 128
5 0 5
B
128,5
Less than 132
5 8 13
C
132,13
Less than 136
13 17 30
D
136,30

Less than 140
30 24 54
E
140,54
Less than 144
54 16 70
F
144,70
Less than 148
70 12 82
G
148,82
Less than 152
82 6 88
H
152,88
Less than 156
88 4 92
I
156,92
Less than 160
92 3 95
J
160,95
Less than 164
95 1 96
K
164,96
Now, plot the graph with the above points to get less
than type ogive.
Take at point M and draw. a line MN
n 96
y 48
2 2
parallel to axis.
x
Also, draw axis.
N O x
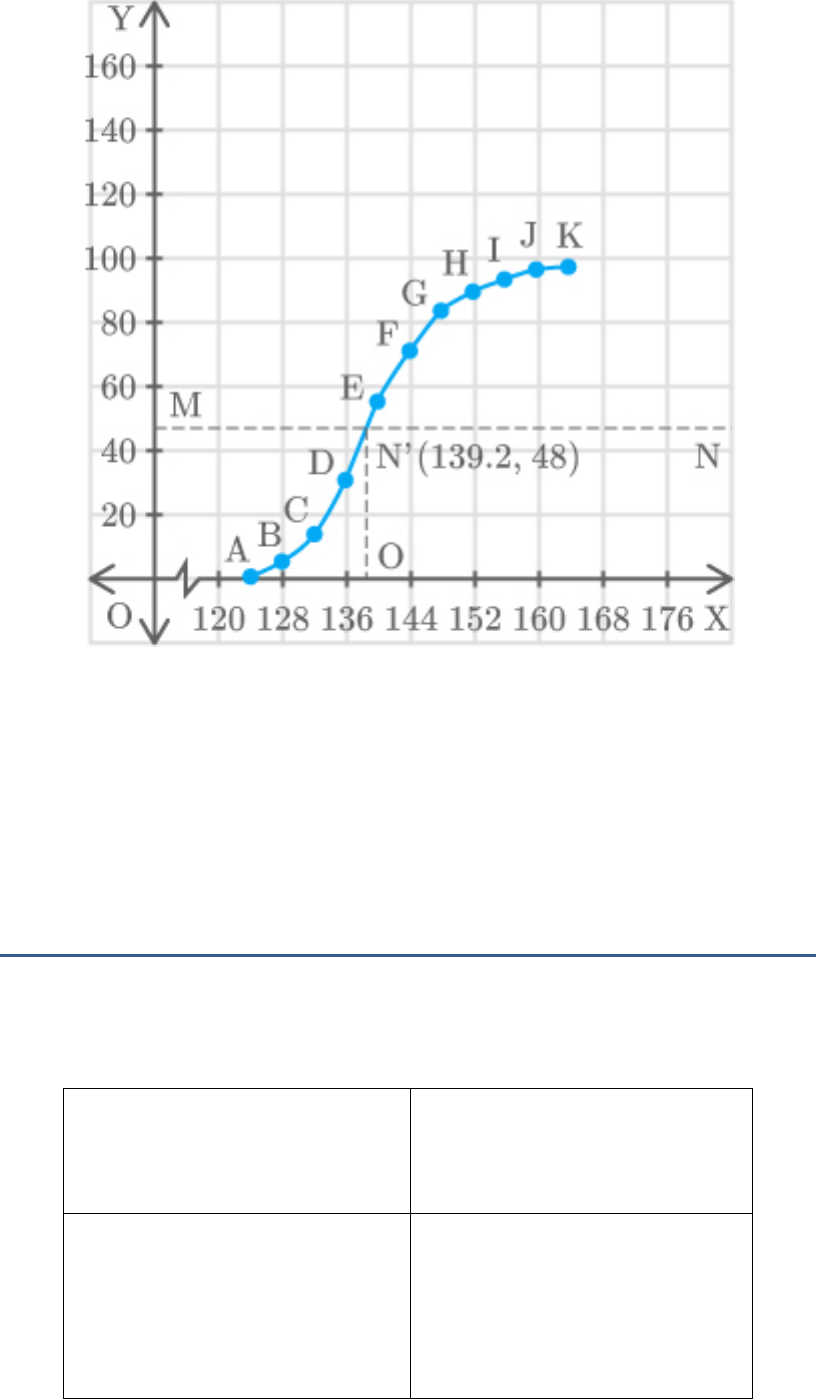
Then, the point O on the axis gives the value of
x
median of the given observations.
Hence, the median height of observations is 139.2 cm.
Question: 11
Size of agricultural holdings in a survey of 200 families
is given in the following table:
Size of agricultural
holdings (in ha)
Number of families
0 – 5
5 – 10
10 – 15
10
15
30

15 – 20
20 – 25
25 – 30
30 – 35
80
40
20
5
Compute median and mode size of the holdings.
Solution:
Class intervals with their respective cumulative
frequency is given by,
Size of
agricultural
holdings (in ha)
Number of
families
i
f
Cumulative
frequency
cf
0 – 5
10
10
5 – 10
15
10 15 25
10 – 15
30
25 30 55
15 – 20
80
55 80 135
20 – 25
40
135 40 175
25 – 30
20
175 20 195
30 – 35
5
195 5 200
From the table,
n 200

Cumulative frequency just greater than
cf
is 135, belonging to interval .
n 200
100
2 2
15 20
Median class
15 20
Lower limit of median class
l
15
Class size
h 5
Frequency of median class
f
80
Cumulative frequency of class preceding median
cf
class
55
Now, find the median.
n
cf
2
Median l h
f
100 55
15 5
80
45
15
16
15 2.812
17.812
Median of data
17.812hectares
Now, the maximum class frequency is 80 belonging to
class interval .
15 20
Modal class
15 20

Lower limit of modal class
l
15
Frequency of modal class
1
f
80
Class size
h 5
Frequency of class preceding the modal class
0
f
30
Frequency of class succeeding the modal class
2
f
40
Now, find the mode.
1 0
1 0 2
f f
Mode l h
2f f f
80 30
15 5
2 80 30 40
50
15 5
160 70
50 5
15
90
25
15
9
15 2.77
17.77
Mode
17.77
Thus, median and mode are given by 17.812 and 17.77.
Question: 12
The annual rainfall record of a city for 66 days is given
in the following table.

Rainfall (in
cm)
0 – 10
10 – 20
20 – 30
30 – 40
40 – 50
50 – 60
Number of
days
22
10
8
15
5
6
Calculate the median rainfall using ogives (of more
than type and of less than type).
Solution:
Class intervals with their respective cumulative
frequency is given by,
Rainfall
(in cm)
Number
of days
i
f
Rainfall (in
cm)
Cumulative
frequency less
than type
cf
Points for Iess
– than type
ogive
Less than 0
0
A
0,0
0 – 10
22
Less than 10
22 0 22
B
10,22
10 – 20
10
Less than 20
22 10 32
C
20,32
20 – 30
8
Less than 30
32 8 40
D
30,40
30 – 40
15
Less than 40
40 15 55
E
40,55
40 – 50
5
Less than 50
55 5 60
F
50,60
50 – 60
6
Less than 60
60 6 66
G
60,66

Class intervals with their respective cumulative
frequency is given by,
Rainfall (in cm)
Cumulative
frequency more than
type
cf
Points for more
– than type
ogive
More than or equal to 0
66
H
0,66
More than or equal to 10
66 22 44
I
10,44
More than or equal to 20
44 10 34
J
20,34
More than or equal to 30
34 8 26
K
30,26
More than or equal to 40
26 15 11
L
40,11
More than or equal to 50
11 5 6
M
50,6
More than or equal to 60
6 6 0
N
60,0
Now,
n 66
n 66
33
2 2
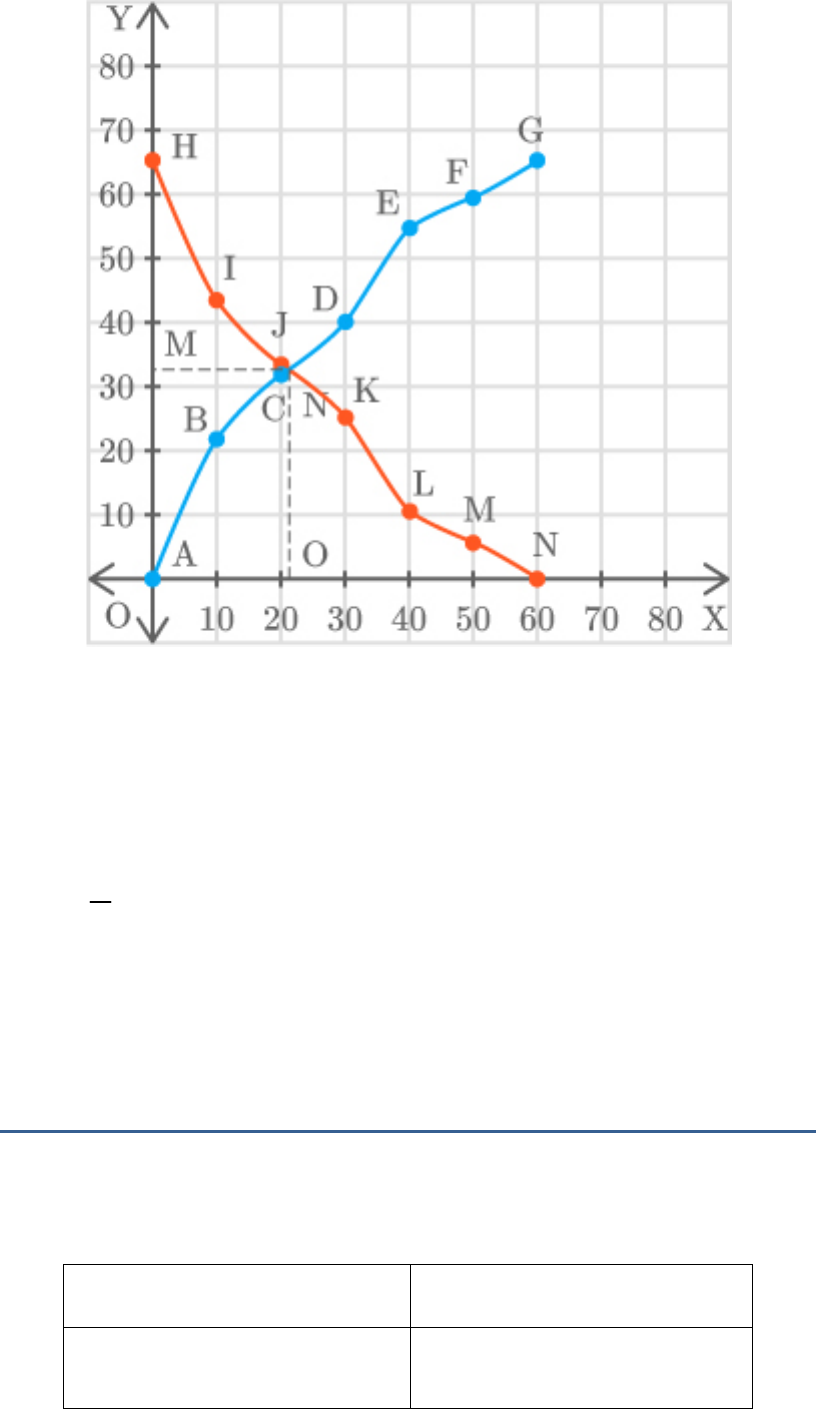
The class intervals are taken on axis and
x
cumulative frequency is taken on axis. The
y
intersection point of less than and more than ogive
gives on the axis and median on the axis.
n
2
y
x
Hence the median rainfall is 21.25 cm.
Question: 13
The following is the frequency distribution of duration
for100 calls made on a mobile phone.
Rainfall (in cm)
Number of calls
95 – 125
14

125 – 155
155 – 185
185 – 215
215 – 245
22
28
21
15
Calculate the average duration (in sec) of a call and
find the median from a cumulative frequency curve.
Solution:
First, find the class mark for each interval. For
i
x
this, the following relation should be used.
i
Upper limit Lower limit
x
2
Take assumed mean and calculate and
a 170
i
d
i i
fd
as follows.
Rainfall (in
cm)
Number of
calls
i
f
Cumulative
frequency
i
x
i i
d x 170
i i
fd
Points
for
ogive
Less than 95
0
0
0
A
95,0
95 – 125
14
0 14 14
110
60
840
B
125,14
125 – 155
22
14 22 36
140
30
660
C

155,36
155 – 185
28
36 28 64
170
0
0
D
185,64
185 – 215
21
64 21 85
200
30
630
E
215,85
215 – 245
15
85 15 100
230
60
900
F
245,100
Total
100
i
f
i i
fd
30
From the table,
Now, find the Mean.
i i
i
fd
x a
f
30
170
100
170 0.3
170.3
Thus, the mean rainfall is 170.3.
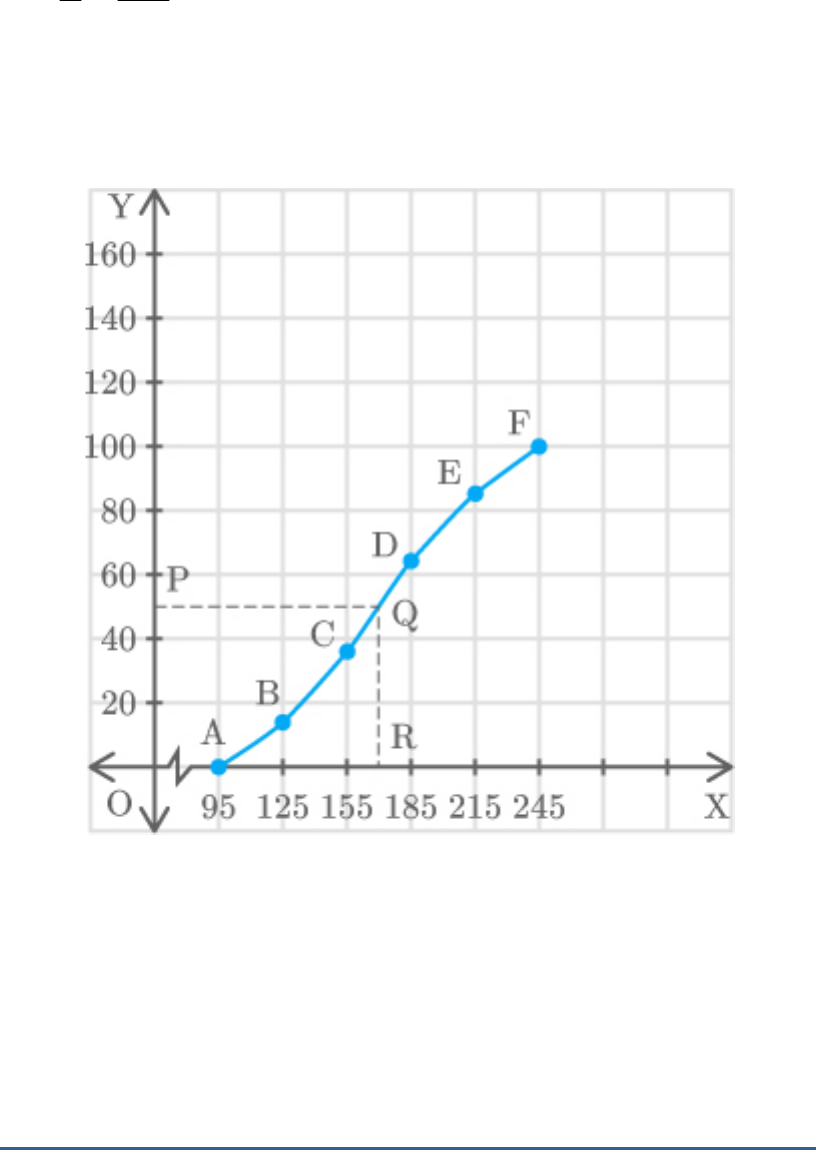
The class intervals are taken on axis and
x
cumulative frequency is taken on axis. Take
y
at point P and draw. a line PQ
n 100
y 50
2 2
parallel to axis.
x
Also, draw axis.
QR x
Then, the point R on the x
-
axis gives the value of
median of the given observations.
Hence, the median time is 170 seconds.
Question: 14

50 students enter for a school javelin throw
competition. The distance (in metres) thrown are
recorded below:
Distance (in
m)
0 – 20
20 – 40
40 – 60
60 – 80
80 – 100
Number of
students
6
11
17
12
4
(i) Construct a cumulative frequency table.
(ii) Draw a cumulative frequency curve (less than
type) and calculate the median distance thrown
by using this curve.
(iii) Calculate the median distance by using the
formula for median.
(iv) Are the median distance calculated in (ii) and (iii)
same?
Solution:
(i) Class intervals with their respective cumulative
frequency is given by,
Distance (in
m)
Number of
students
i
f
Cumulative
frequency
cf
Points of
less than
ogive
Less than 0
0
0
A
0,0
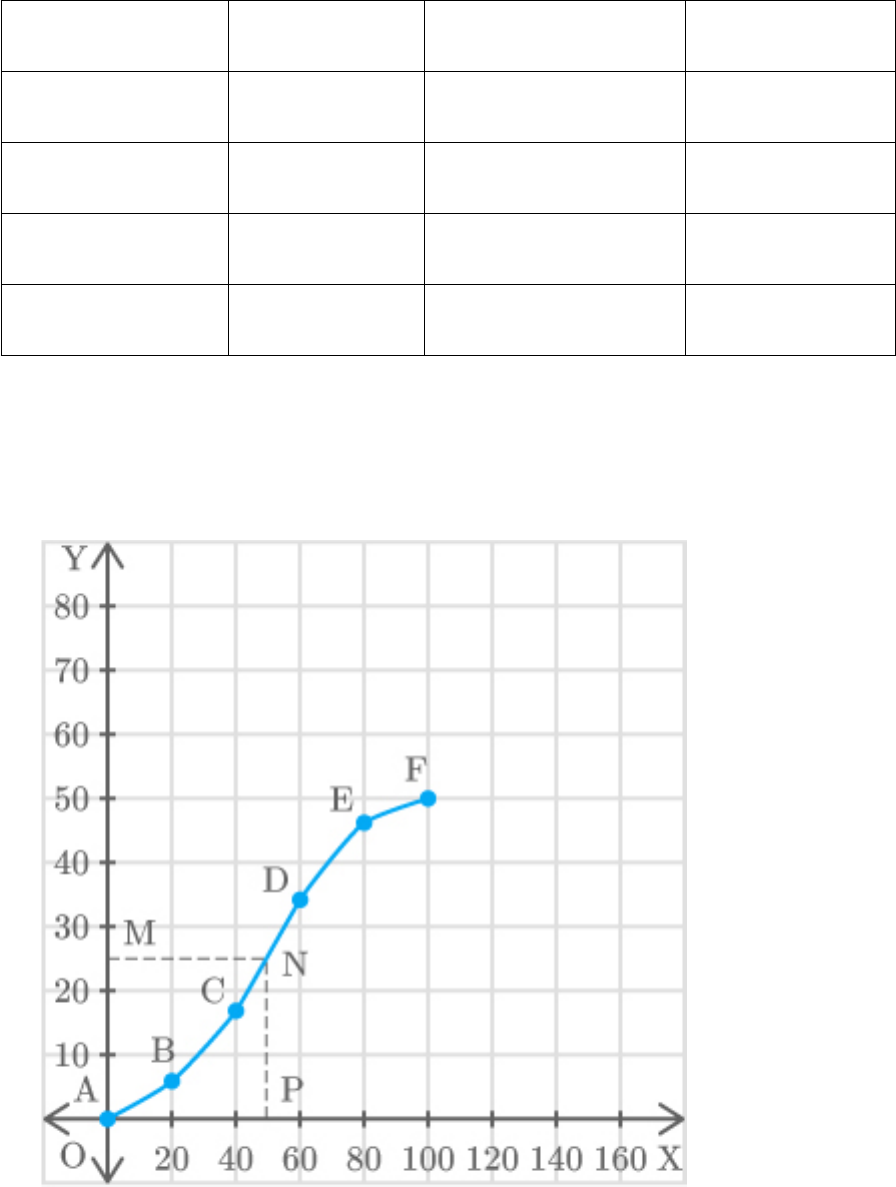
0 – 20
6
0 6 6
B
20,6
20 – 40
11
6 11 17
C
40,17
40 – 60
17
17 17 34
D
60,34
60 – 80
12
34 12 46
E
80,46
80 – 100
4
46 4 50
F
100,50
(ii) Cumulative frequency (less than type) curve is
given by,
The class intervals are taken on axis and
x
cumulative frequency is taken on axis. Take
y

at point M and draw. a line MN
n 50
y 25
2 2
parallel to axis.
x
Also, draw axis.
NP x
The point P on the axis gives the value of
x
median of the given observations.
Hence, the median distance is 50 m.
(iii) From the table,
n 50
Cumulative frequency just greater than
cf
is 34, belonging to interval .
n 50
25
2 2
40 60
Median class
40 60
Lower limit of median class
l
40
Class size
h 20
Frequency of median class
f
17
Cumulative frequency of class preceding
cf
median class
17
Now, find the median.
n
cf
2
Median l h
f

25 17
40 20
17
8 20
40
17
160
40
17
40 9.41
49.41
Thus, median distance 49.41 m.
(iv) Median distance calculated by formula and graph
are almost equal i.e., differ only by 0.59 m.
Hence, median distance calculated in part (ii) and
(iii) are same.